Note
Access to this page requires authorization. You can try signing in or changing directories.
Access to this page requires authorization. You can try changing directories.
Sunday, July 14, 2019 12:09 PM
Hello, somebody has an experience with how to MsSqlserver with Prometheus ?
Pivot
Tuesday, July 23, 2019 3:34 AM ✅Answered
Hi, this guide was installed and implemented and was very effective
https://github.com/martinlindhe/wmi_exporter/blob/master/README.md
Pivot
Sunday, July 14, 2019 2:29 PM | 1 vote
https://jcooney.net/post/2017/10/23/prometheus-grafana-sql.html
Personally I have not used this tool( I have been using SQL Redgate for years) but can you explore what is your expectations of this tool. what is the goal?
Best Regards,Uri Dimant SQL Server MVP, http://sqlblog.com/blogs/uri_dimant/
MS SQL optimization: MS SQL Development and Optimization
MS SQL Consulting: Large scale of database and data cleansing
Remote DBA Services: Improves MS SQL Database Performance
SQL Server Integration Services: Business Intelligence
Monday, July 15, 2019 2:21 AM | 1 vote
Hi MohammadBayat,
>> How to Monitor MSSQL Server With Prometheus ?
Please refer to Monitoring MySQL Server Using Prometheus, Grafana, and mysqld_exporter to get some related information.
Hope this could help you.
Best regards,
Cathy Ji
MSDN Community Support
Please remember to click "Mark as Answer" the responses that resolved your issue, and to click "Unmark as Answer" if not. This can be beneficial to other community members reading this thread. If you have any compliments or complaints to MSDN Support, feel free to contact MSDNFSF@microsoft.com
Tuesday, July 16, 2019 6:08 AM
The goal is to implement integrated monitoring
I found an exporter on my site link but did not understand how it works
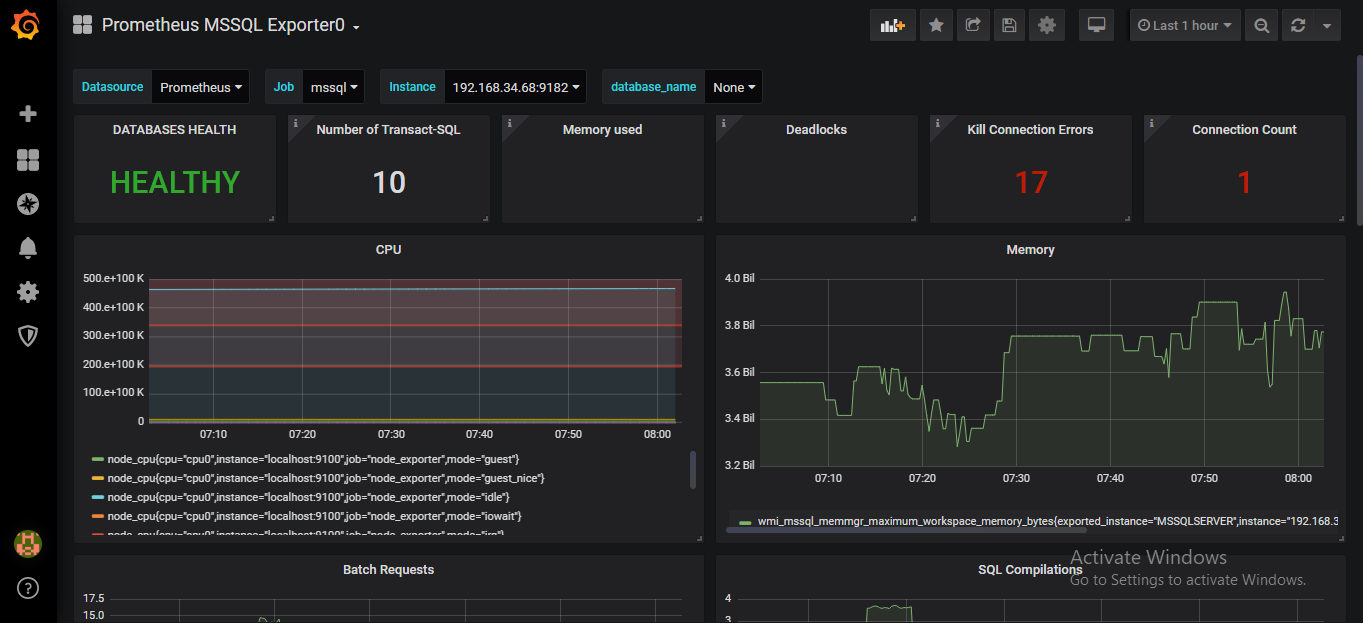
https://github.com/awaragi/prometheus-mssql-exporter
- mssql_instance_local_time Number of seconds since epoch on local instance
- mssql_connections{database,state} Number of active connections
- mssql_deadlocks Number of lock requests per second that resulted in a deadlock since last restart
- mssql_user_errors Number of user errors/sec since last restart
- mssql_kill_connection_errors Number of kill connection errors/sec since last restart
- mssql_log_growths{database} Total number of times the transaction log for the database has been expanded last restart
- mssql_page_life_expectancy Indicates the minimum number of seconds a page will stay in the buffer pool on this node without references. The traditional advice from Microsoft used to be that the PLE should remain above 300 seconds
- mssql_io_stall{database,type} Wait time (ms) of stall since last restart
- mssql_io_stall_total{database} Wait time (ms) of stall since last restart
- mssql_batch_requests Number of Transact-SQL command batches received per second. This statistic is affected by all constraints (such as I/O, number of users, cachesize, complexity of requests, and so on). High batch requests mean good throughput
- mssql_page_fault_count Number of page faults since last restart
- mssql_memory_utilization_percentage Percentage of memory utilization
- mssql_total_physical_memory_kb Total physical memory in KB
- mssql_available_physical_memory_kb Available physical memory in KB
- mssql_total_page_file_kb Total page file in KB
- mssql_available_page_file_kb Available page file in KB
Pivot
Tuesday, July 16, 2019 6:09 AM
This site is about MYSQl
Pivot
Tuesday, July 16, 2019 6:29 AM | 1 vote
Hi
See those links
https://www.olivercoding.com/2018-09-18-mssql-prometheus/
https://jcooney.net/post/2017/10/23/prometheus-grafana-sql.html
Best Regards,Uri Dimant SQL Server MVP, http://sqlblog.com/blogs/uri_dimant/
MS SQL optimization: MS SQL Development and Optimization
MS SQL Consulting: Large scale of database and data cleansing
Remote DBA Services: Improves MS SQL Database Performance
SQL Server Integration Services: Business Intelligence
Monday, February 24, 2020 7:13 AM
Hi, can you please share your metrics or tell me how did you create the dashboard for mssql?