Note
Access to this page requires authorization. You can try signing in or changing directories.
Access to this page requires authorization. You can try changing directories.
Estimated time: 5 minutes
Ask the agent to investigate an issue by using the context connected to your agent.
Tip
New customers can evaluate SRE Agent without paying the always-on charges for the first 30 days. For more information, see Evaluate SRE Agent.
What you accomplish
By the end of this guide, you:
- Ask the agent to investigate a live issue in chat
- Watch it use the code, logs, and Azure resources available to it
- Review a diagnosis grounded in the connected sources
Prerequisites
| Requirement | Details |
|---|---|
| Completed Steps 1–2 | Create and set up and Team onboarding. |
| Recommended context | Connect code, logs, and Azure resources for richer results. You can still investigate with partial setup. |
Tip
You can still run an investigation without all data sources connected, but the results are richer with code and telemetry. Optional Azure resource access can add live resource context. To complete your setup, see Complete your setup.
Start the investigation
Open a new chat thread and describe the problem you want the agent to investigate.
Select New thread in the left sidebar.
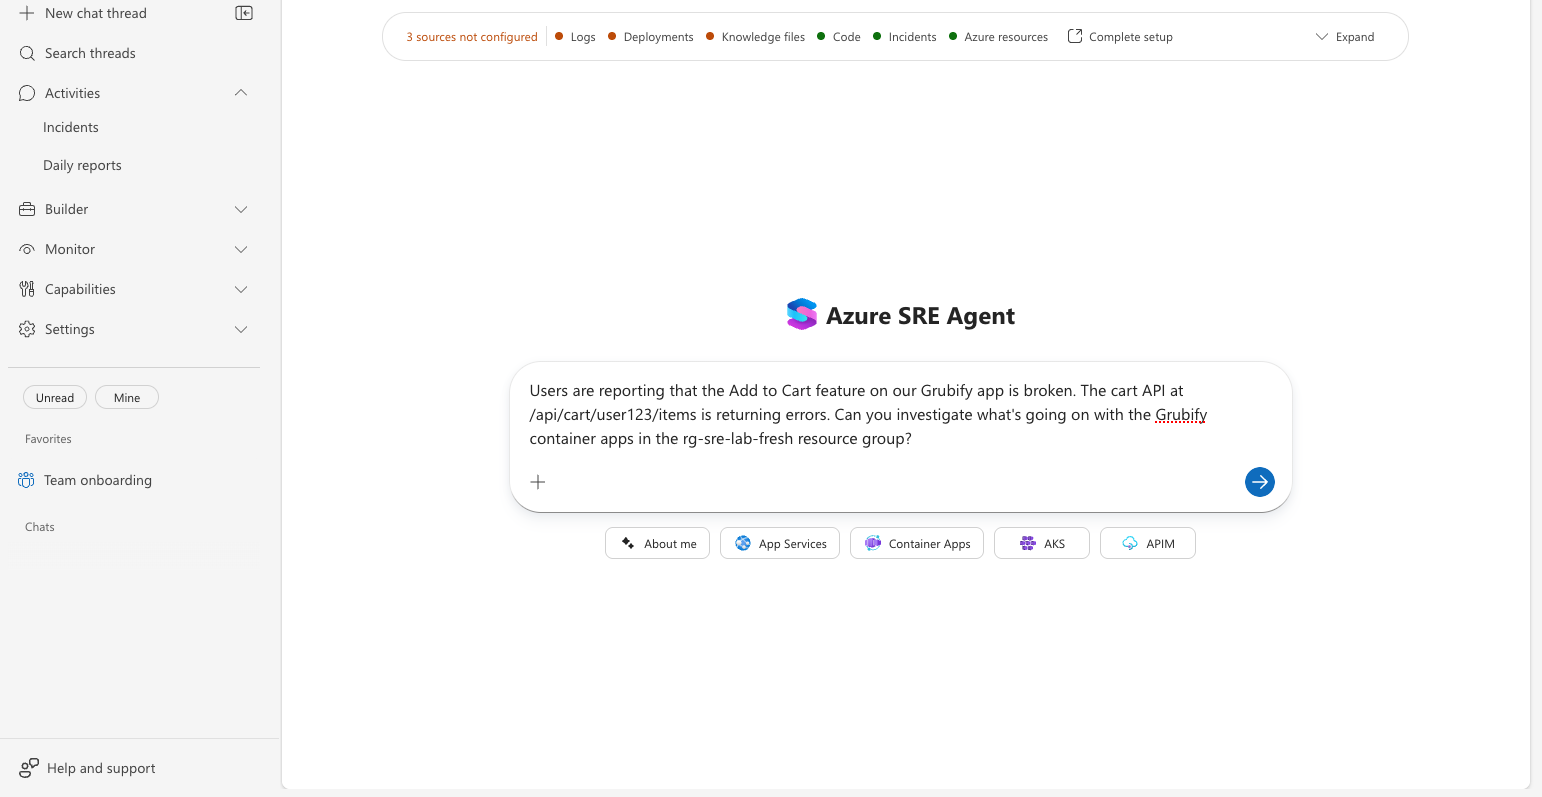
Describe the problem you want investigated. Be specific about which service or resource group is affected. For example:
"Users report that the Add to Cart feature on our app is broken. The cart API returns errors. Can you investigate the container apps in the resource group?"
Select Send.
Watch the agent work
The agent builds an investigation plan and executes it step by step. You can watch each phase in real time.
Phase 1: Read context: The agent reads the knowledge files it built during onboarding, including architecture docs, team context, and runbooks, to orient itself.
Phase 2: Explore code: If you connect a code repository, the agent reads relevant source files, searches for code paths related to the issue, and traces the call chain.
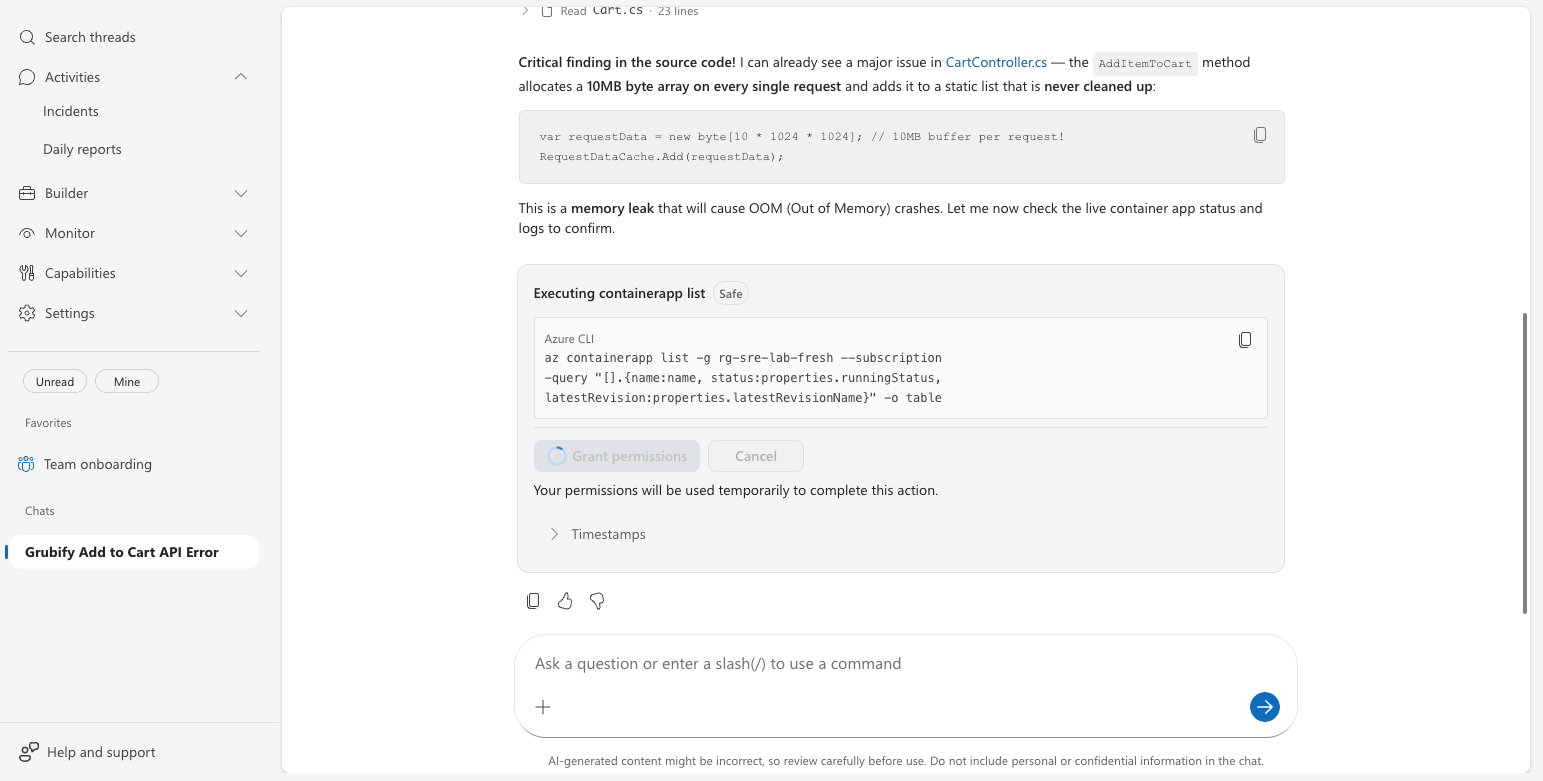
Phase 3: Query Azure resources: If you connect Azure resources and logging providers, the agent checks the live resource state and available telemetry.
Phase 4: Deliver the diagnosis: Based on the available evidence, the agent can present the following details:
- Root cause: The specific code bug or configuration issue, with file and line number references.
- Evidence: Code snippets, logs, and resource details that support the finding.
- Recommended fix: Exactly what to change, with a code diff showing lines to remove or modify.
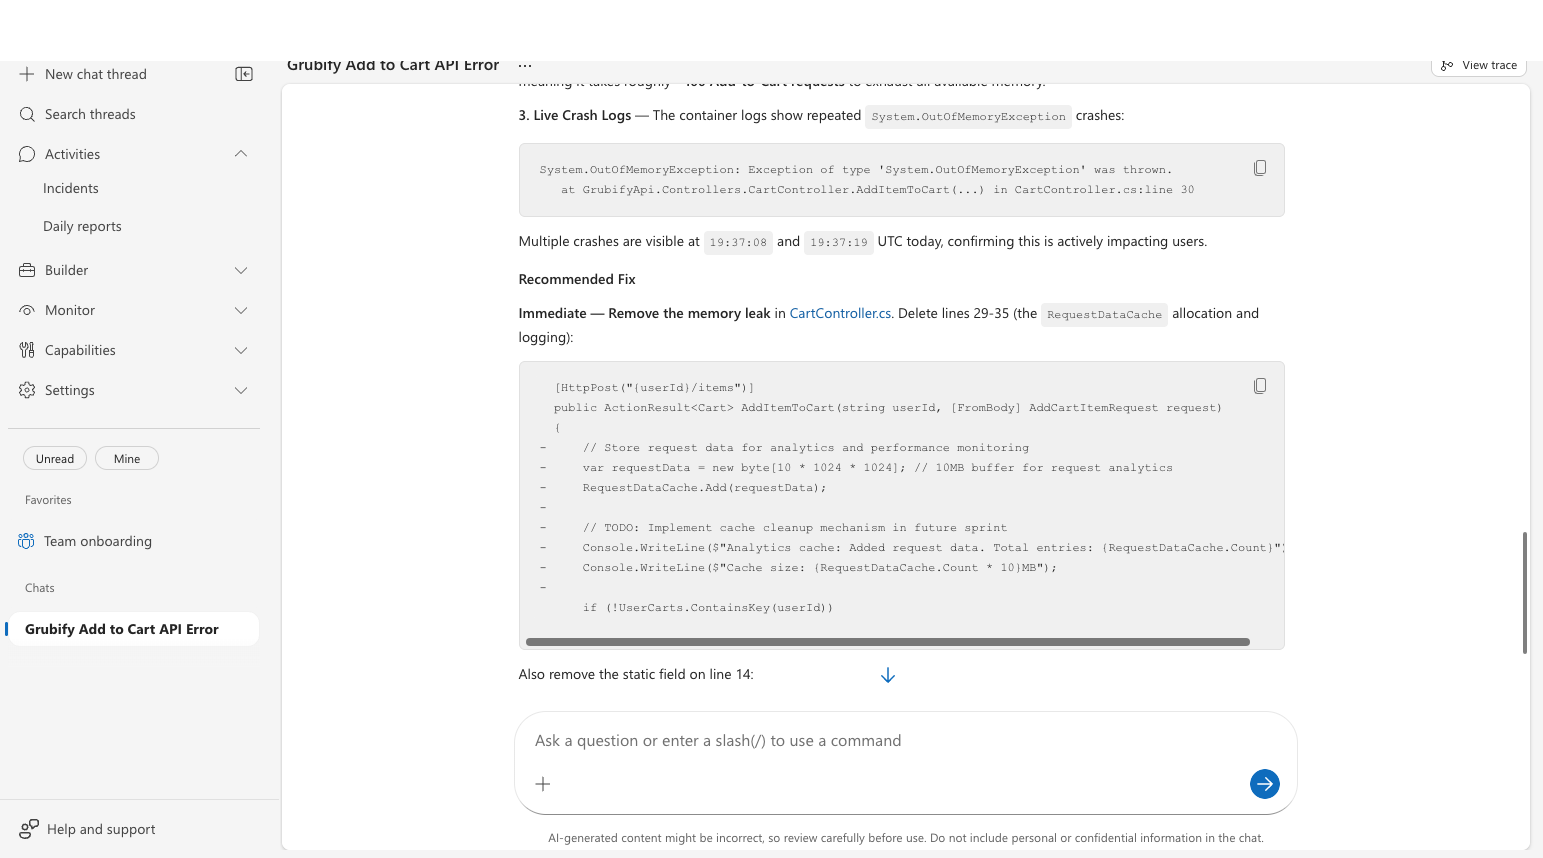
Checkpoint: The response identifies the sources used and explains the diagnosis or the next data source needed. When you connect code, logs, and Azure resources, the response can include code references, telemetry evidence, and a recommended fix.
Tip
Try asking about something real in your environment:
- "Check the health of the container apps in resource group X."
- "We're seeing 5xx errors on our API. Can you investigate?"
- "What recent changes were deployed to our backend service?"
Next step
Related content
- Deep context: How the agent reads, searches, and understands code.
- Root cause analysis: How the agent identifies root causes.
- Complete your setup: Connect any data sources you skipped.
- Ask the agent for help: More examples of what you can ask.