Note
Access to this page requires authorization. You can try signing in or changing directories.
Access to this page requires authorization. You can try changing directories.
Estimated time: 10 minutes
Connect your incident platform and configure how your agent investigates matching alerts.
What you accomplish
By the end of this step, your agent:
- Connects to Azure Monitor as your incident platform
- Receives incidents filtered by severity through a response plan
- Investigates matching alerts and reports its findings
Prerequisites
| Requirement | Details |
|---|---|
| Completed Steps 1–3 | Create and set up, Team onboarding, and First investigation. |
| For the end-to-end example | A connected code repository and logging provider, a non-production Azure Monitor test alert, and permission to approve proposed actions. |
Connect Azure Monitor
Link Azure Monitor as your incident platform so the agent automatically receives alerts.
- In the left sidebar, go to Incidents > Triggers + response plans.
- If no incident platform is connected, select Connect an incident platform.
- In Choose platform, select Azure Monitor.
- In Connect to platform, complete the required fields, and then select Save to connect Azure Monitor.
Wait for the connection to complete. The status changes to "Azure Monitor connected. Your next step is to set up incident response plans."
Checkpoint: The incident platform page shows a green checkmark with Azure Monitor connected.
Tip
You can also connect PagerDuty or ServiceNow from the platform picker.
Create an incident response plan
An incident response plan tells the agent which incidents to pick up and how much autonomy it has. The following steps are for Azure Monitor. PagerDuty and ServiceNow response plans use different filter fields based on their own incident metadata, such as priority, category, and assignment group.
Go to Incidents > Triggers + response plans.
Open the creation dialog:
- If no response plans exist, select Add an incident response plan.
- If a response plan already exists, select Create a response plan.
In Step 1: Response plan, configure the response plan details:
- In Incident response plan name, enter a descriptive name, such as
test-alerts-review. - In Severity, select the severity used by your non-production test alert.
- In Title contains, enter text that appears in the test alert title.
- In Title does not contain, add any title keywords that the plan should exclude.
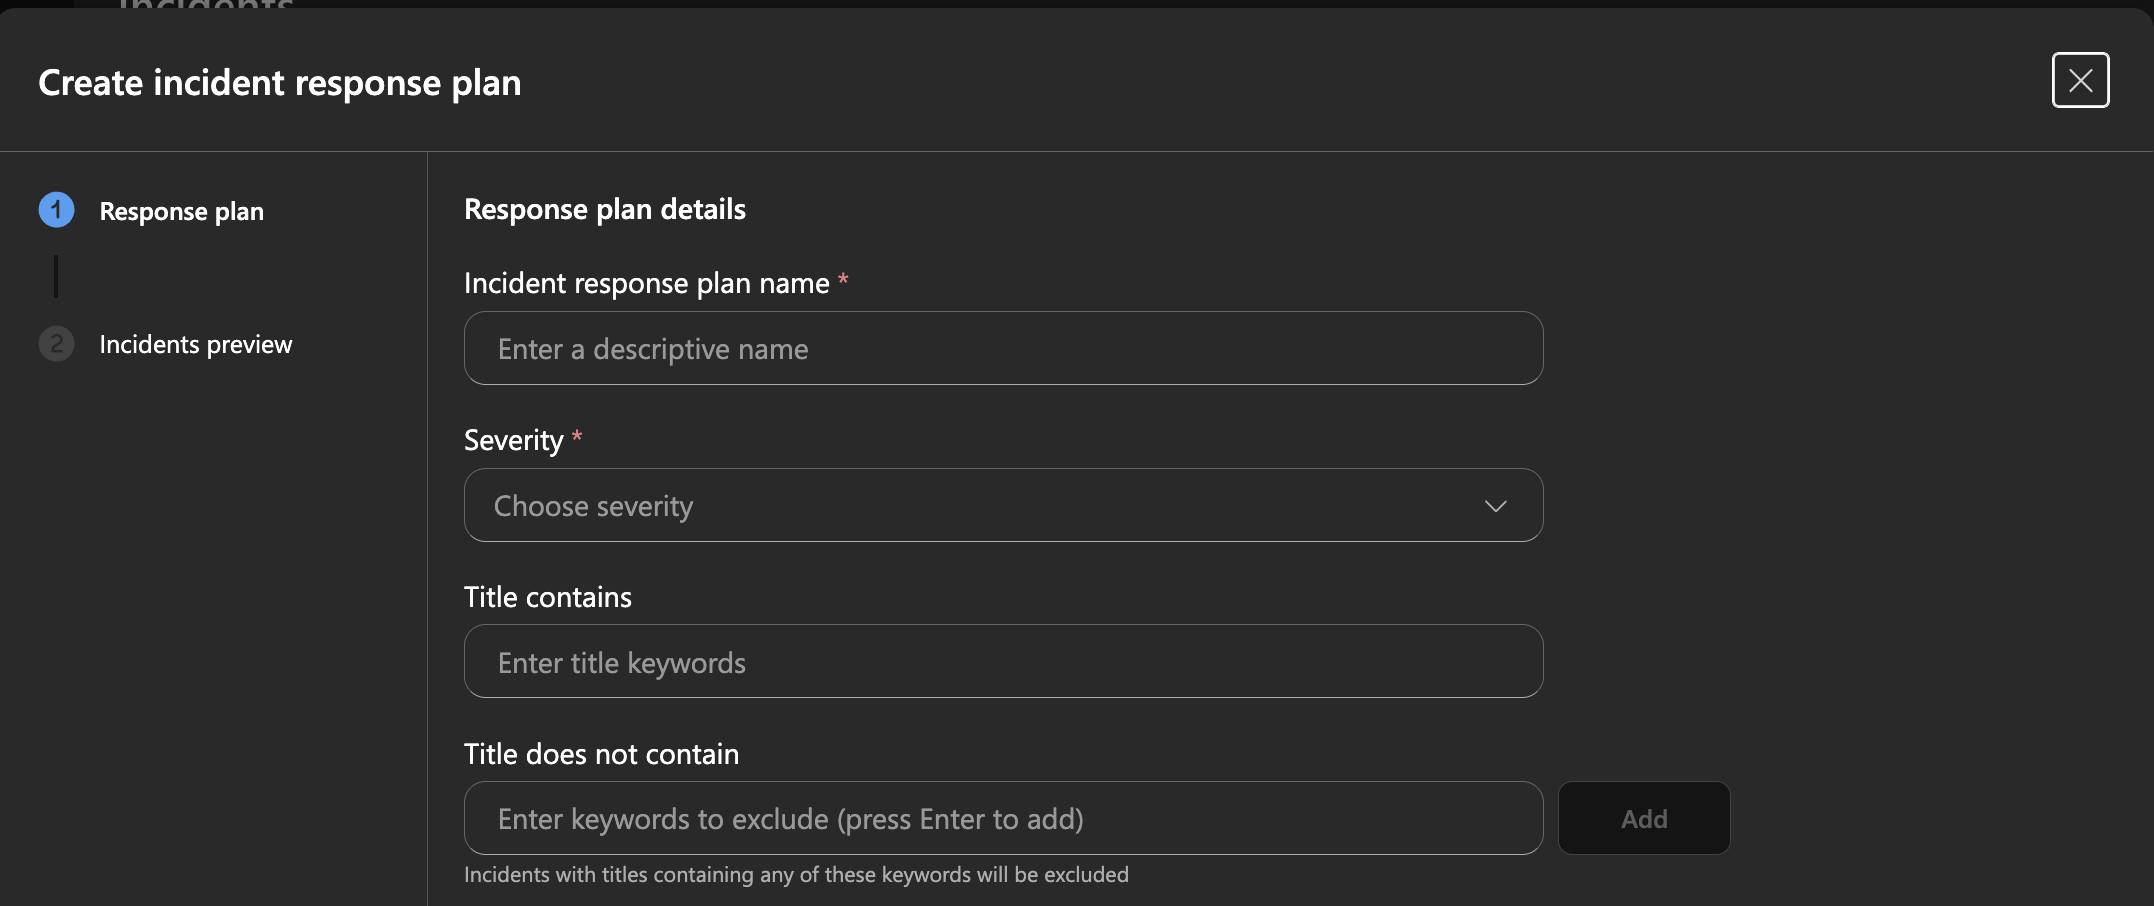
- In Incident response plan name, enter a descriptive name, such as
In the same step, configure how the agent responds:
- In Response subagent, select the agent that should investigate matching alerts.
- Under Agent autonomy level, select Review so proposed actions require approval. Autonomous is the default.
- Optionally enable Alert reinvestigation cooldown and set the cooldown time to avoid reinvestigating the same alert repeatedly within that period.
Select Next.
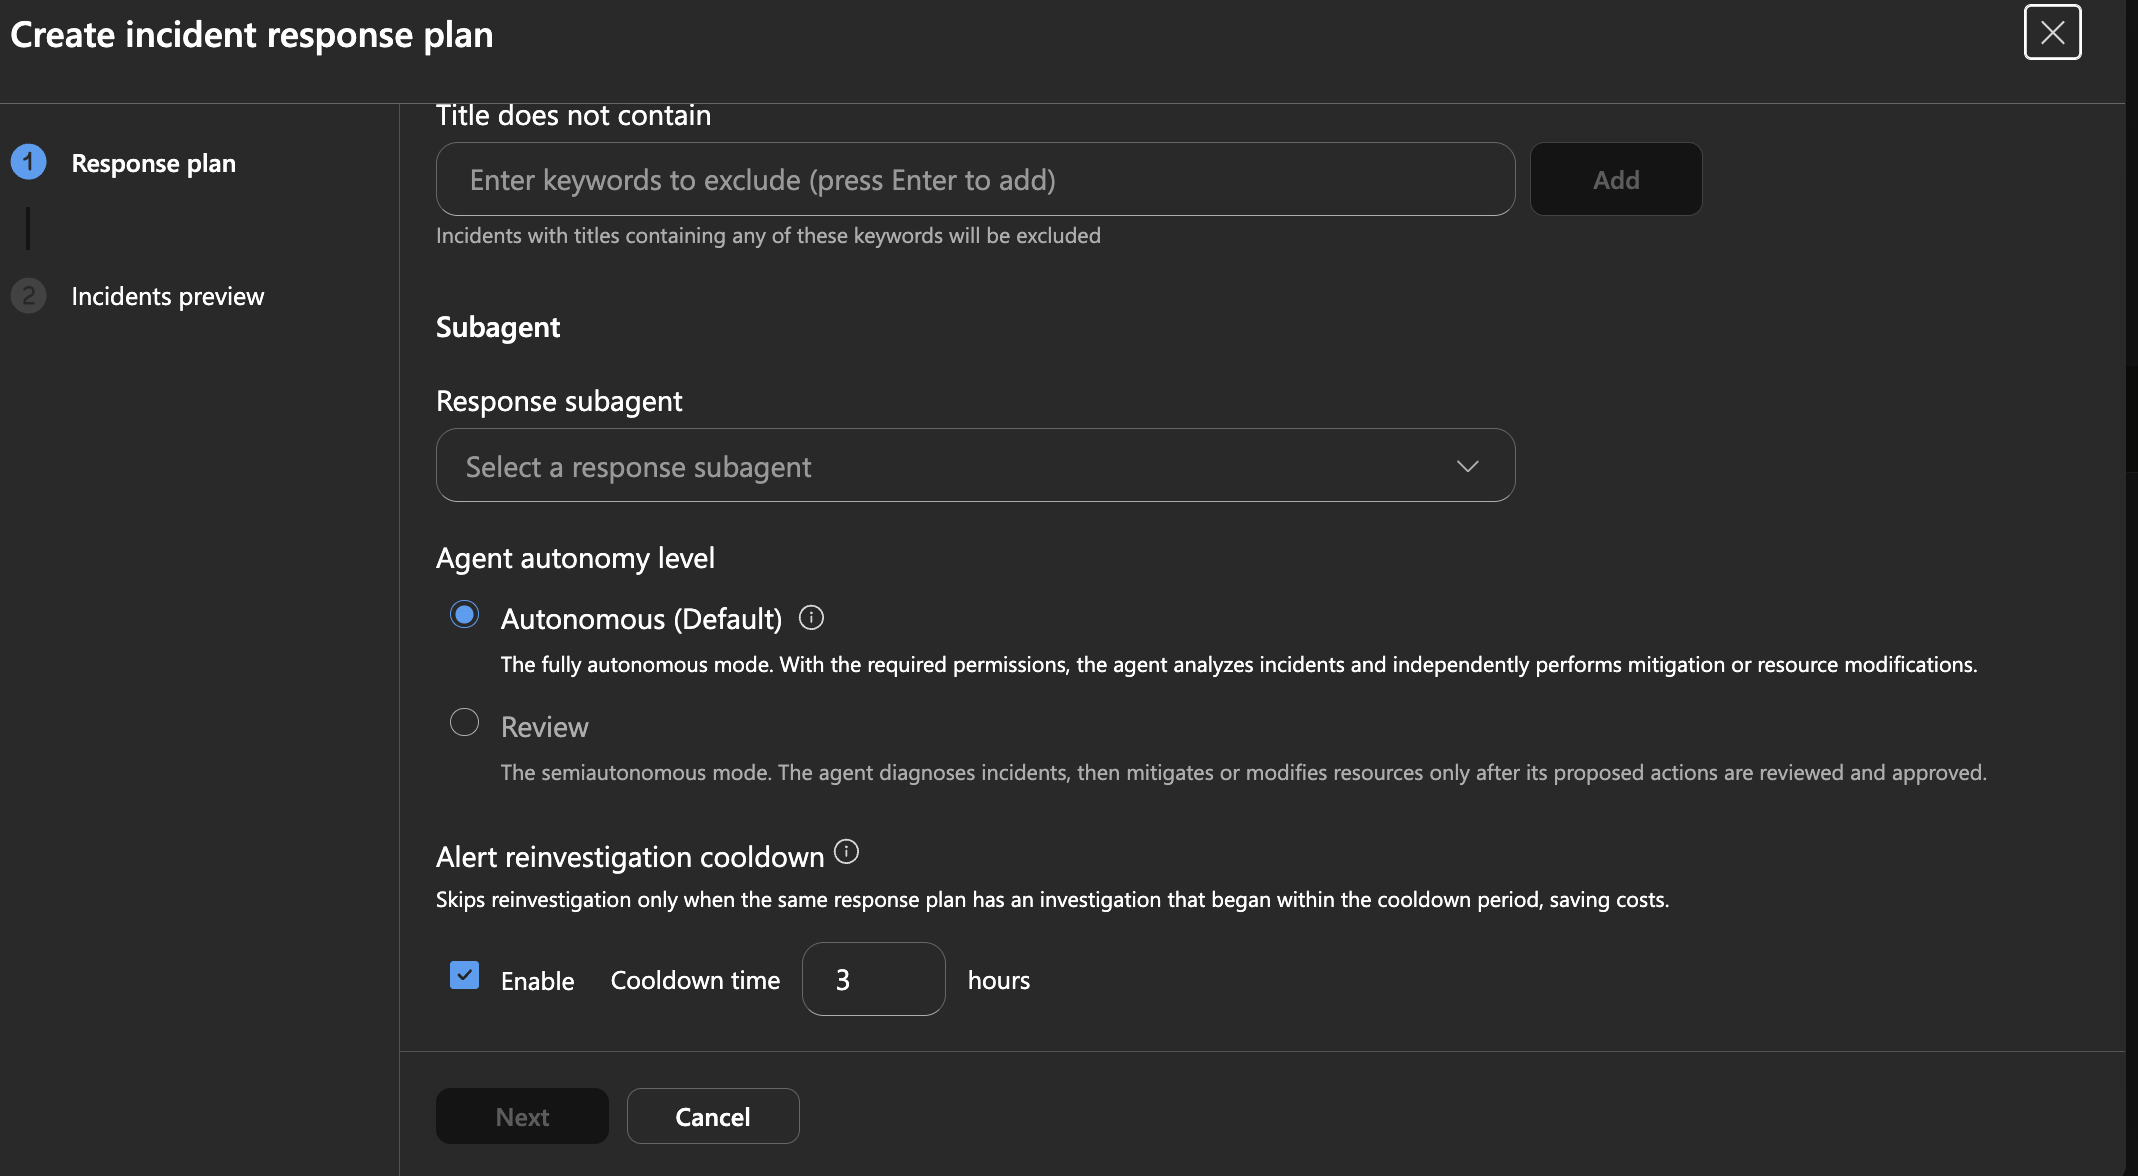
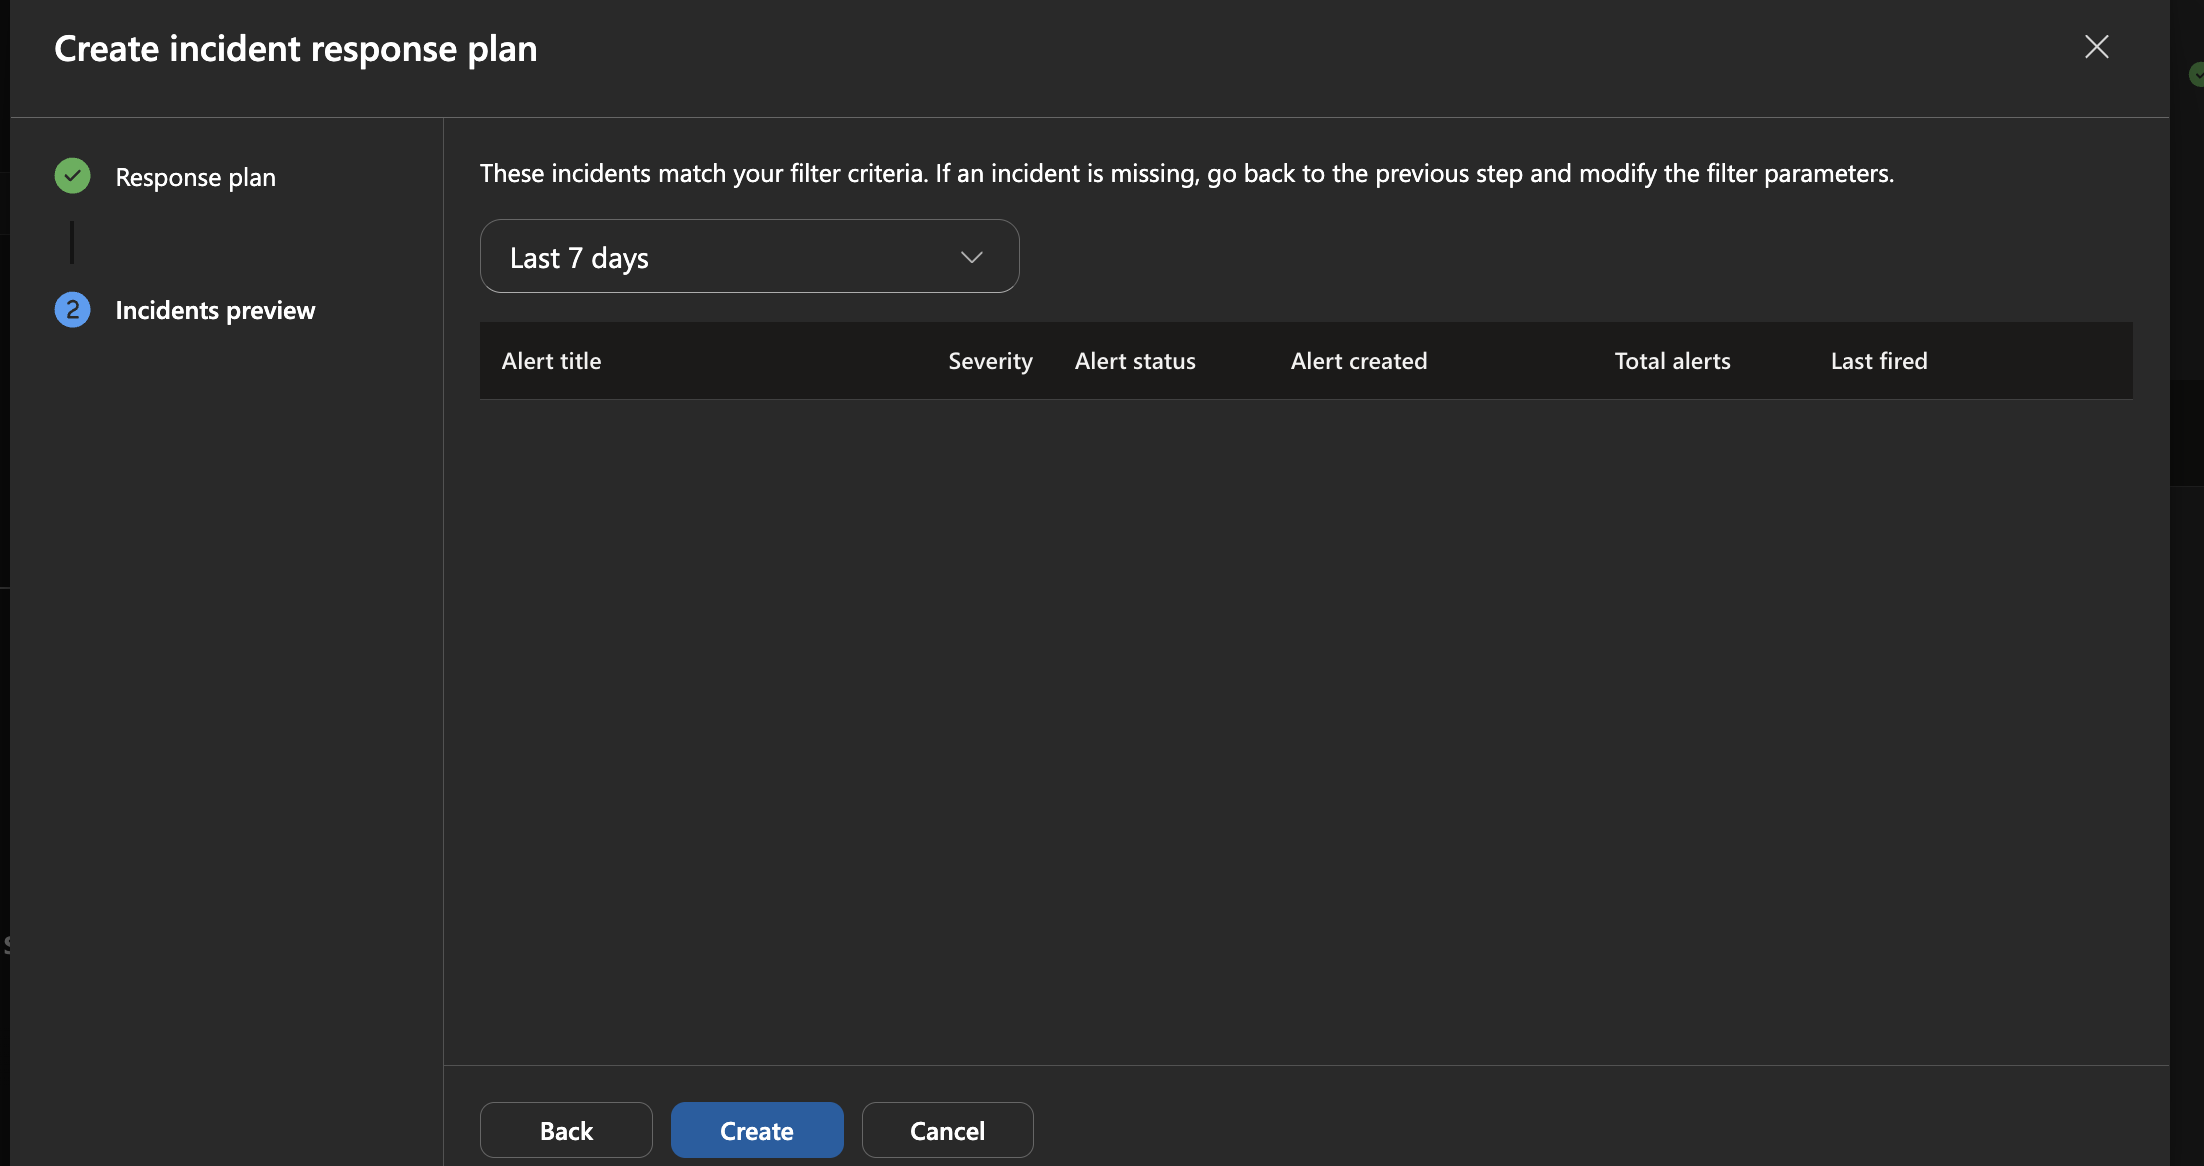
In Step 2: Incidents preview:
- Select a lookback period, such as Last 7 days.
- Review the matching alerts. If an expected alert is missing, select Back and adjust the filters.
- An empty list means no alerts matched the current filters and lookback period.
Select Create.
Checkpoint: Your response plan appears in the list with status On and mode Review.
What happens when an alert fires
When Azure Monitor fires an alert that matches your response plan, the agent investigates automatically. What the agent does depends on the context you gave it. Runbooks, code repositories, Azure resources, and prior investigations all shape the depth and actions of the investigation.
Example: HTTP 500 errors on a container app
In this example, the agent has a runbook for handling HTTP 500 errors, a connected code repository, and Azure resource access.
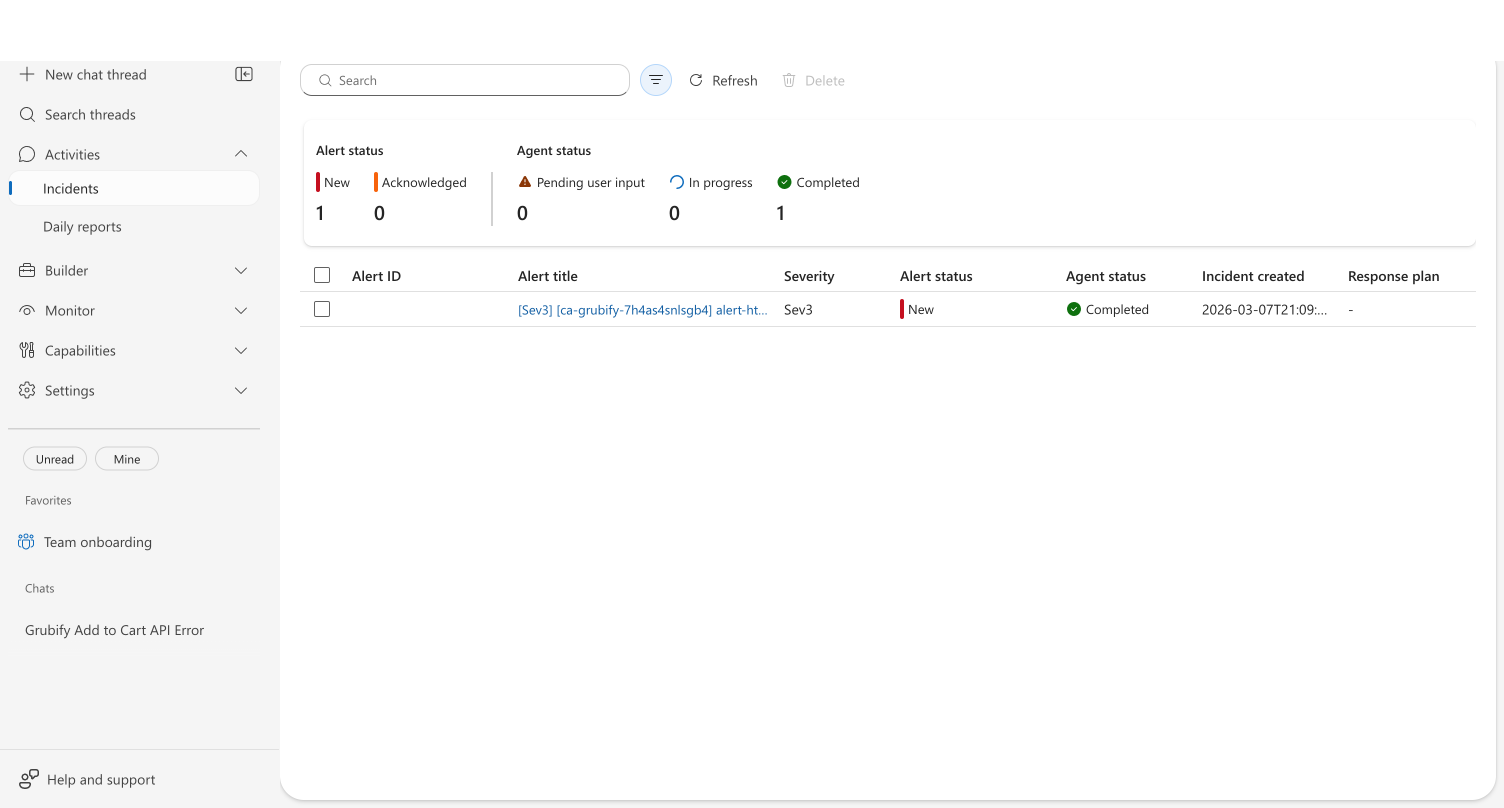
The agent builds a plan from your runbook. Rather than following a generic troubleshooting sequence, the agent reads the HTTP 500 runbook you upload during onboarding and follows your team's procedures. The agent checks for upstream dependencies first, then connection pool, then recent deployments.
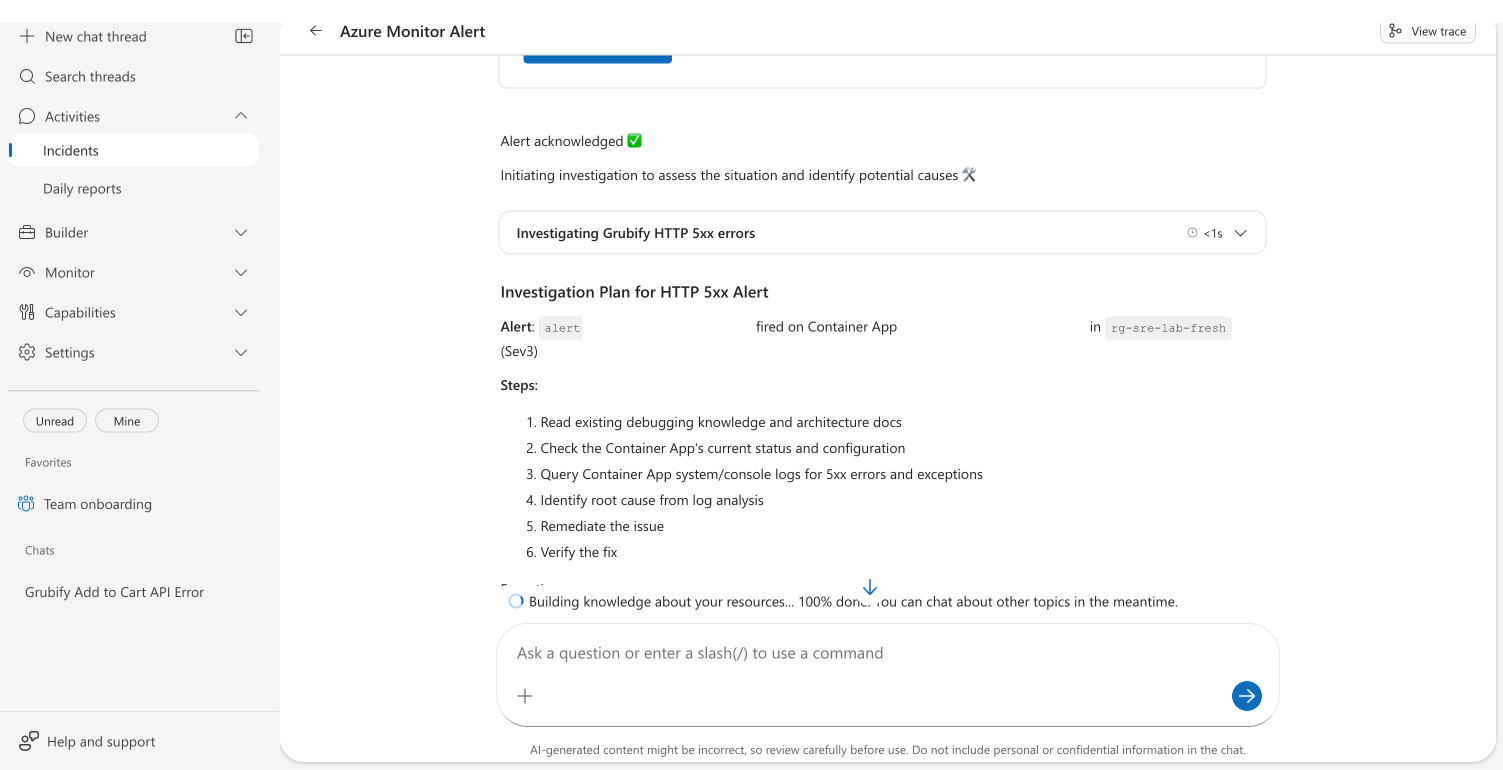
The agent recalls prior knowledge. If the agent investigated a similar issue before, it recognizes the pattern and skips discovery. It does this operation to combine your runbook procedures with what it learned from previous investigations.
The agent proposes or takes action according to the selected mode. In Review mode, the agent asks for approval before an action. In Autonomous mode, it can act within its configured permissions.
The agent delivers an investigation summary. The report explains what the agent found, the evidence it used, and the next action for your team.
Note
Your results vary based on the context your agent has. An agent with more runbooks, connected repositories, and prior investigations produces deeper, more targeted responses.