Note
Access to this page requires authorization. You can try signing in or changing directories.
Access to this page requires authorization. You can try changing directories.
Azure DevOps Services | Azure DevOps Server | Azure DevOps Server 2022
Code coverage helps you determine the proportion of your project's code that is actually being tested, such as by unit tests. To increase your confidence of the code changes and guard effectively against bugs, your tests should exercise or cover a large proportion of your code.
When you review code coverage results, you can identify code paths that tests don't cover. This information helps you improve test coverage over time by reducing test debt.
This article shows you how to view, configure, and troubleshoot code coverage in Azure Pipelines. You learn how to set up diff coverage for pull requests, configure coverage policies, and resolve common issues.
Note
While you can build code from various version control systems that Azure Pipelines supports, the code coverage for pull requests feature discussed in this article is currently available only for Azure Repos.
Supported formats, tasks, and artifacts
Supported formats
Azure Pipelines can publish coverage results, through the Publish Code Coverage Results v2 task. The task can display the results in 2 different views:
- For cobertura, jacoco, clover, gcov, pcov, and other xml formats, an HTML view generates, containing more details of the code coverage report, and is preferred by most of the customers.
- For
.coverage/.cjson/.covx– a tabular view generates, containing less details than the HTML view.
Artifacts and results
You can view the code coverage artifacts published during the build under the Summary tab on the pipeline run summary.

Additionally, you can review the results from the code coverage report in the Code Coverage tab:

- If you publish code coverage using Cobertura or JaCoCo coverage formats, the code coverage artifact contains an
.htmlfile that you can view offline for further analysis.
- For .NET and .NET Core, you can access the link to download the artifact by choosing the code coverage milestone in the build summary.
- Visual Studio Test can collect coverage for .NET and .NET Core apps. It produces
.coveragefiles that you can download and use for further analysis in Visual Studio.
Tasks
Publish Code Coverage Results publishes code coverage results to Azure Pipelines, which were produced by a build in Cobertura or JaCoCo format.
Built-in tasks such as Visual Studio Test, .NET Core, Ant, Maven, Gulp, Grunt, and Gradle provide the option to publish code coverage data to the pipeline.
Docker considerations
For apps that use Docker, you can run builds and tests inside the container and generate code coverage results within the container. To publish the results to the pipeline, make the resulting artifacts available to the Publish Code Coverage Results task. For reference, see a similar example for publishing test results under the Build, test, and publish results with a Docker file section for Docker.
Important considerations
- In a multistage YAML pipeline, code coverage results are only available after the entire pipeline completes. You might need to separate the build stage into its own pipeline if you want to review code coverage results before deploying to production.
- Merging code coverage results from multiple test runs currently works only for .NET and .NET Core. There are no plans to support other formats.
Full coverage vs diff coverage
Full coverage measures coverage for the entire codebase of a project. In the context of pull requests, developers focus on the changes they're making and want to know whether the specific lines of code they added or changed are covered. This type of coverage is diff coverage.
The coverage settings YAML differs from a YAML pipeline because the coverage settings apply to your repository and are used regardless of which pipeline builds your code. This separation also means that if you use classic designer-based build pipelines, you get the code coverage status check for pull requests.
Coverage indicators appear in the changed files view regardless of whether pull request comment details are turned on.
Configure diff coverage
To change the default settings of the code coverage experience for pull requests, include a configuration YAML file named azurepipelines-coverage.yml at the root of your repository. Set the desired values in this file, and Azure DevOps uses them automatically the next time the pipeline runs.
You can change the following settings:

Example configuration
coverage:
  status:                    # Code coverage status will be posted to pull requests based on targets defined below.
    comments: on             # Off by default. When on, details about coverage for each file changed will be posted as a pull request comment.
    diff:                    # Diff coverage is code coverage only for the lines changed in a pull request.
      target: 60%            # Set this to a desired percentage. Default is 70 percent
You can find more examples with details in the code coverage YAML samples repository.
Coverage status, details, and indicators
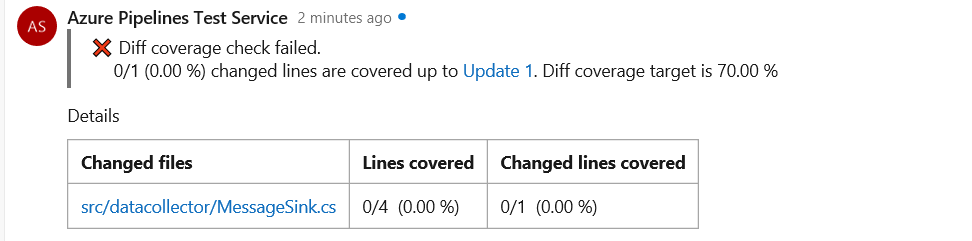
When you set up a pipeline to collect and publish code coverage, it posts a code coverage status when you create a pull request. By default, the server checks that tests cover at least 70% of changed lines. You can change the diff coverage threshold target to a value you choose by modifying the target parameter mentioned earlier.
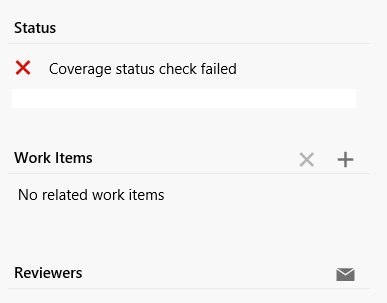
The status check calculates diff coverage for all files in the pull request. To see the percentage for each file, enable Details as described in the previous section. When enabled, the system posts the details as a comment on the pull request.
In the changed files view of a pull request, changed lines are also annotated with coverage indicators to show whether those lines are covered.

Enforce branch protection with a code coverage policy
By default, the code coverage status check on pull requests is advisory - it doesn't block merges with low coverage. To ensure changes meet a minimum coverage threshold before merging, configure a branch policy that uses the coverage status check.
Code coverage status posted from a pipeline follows the naming convention {name-of-your-pipeline/codecoverage}.
Note
- Branch policies in Azure Repos (even optional policies) prevent pull requests from completing automatically if they fail. This behavior isn't specific to code coverage policy.
- The code coverage policy isn't overridden to Failed if the build fails.
Troubleshooting guide
Why do I see duplicate DLLs in the coverage view of the Code Coverage tab?
You might see duplicate DLLs when both .NET Core and .NET Framework are used in the pipeline. Expect duplicate DLLs when both are used, which is by design since the same module comes from different paths.
Why is there no coverage data in the Code Coverage tab?
Several reasons can cause this issue:
No tests or DLLs present: If the files don't contain tests or DLLs, the coverage value is 0. Azure DevOps doesn't display code coverage data in the tab when the coverage value is 0. Instead, it shows a message under the Code Coverage tab explaining why there's no coverage data.
Empty coverage XML: When you use Publish Code Coverage tasks, if the coverage
.xmlprovided as input doesn't contain any information or has zero lines covered, no coverage data appears under the tab. Check why the coverage.xmlfile (input file) is empty or lacks information.Build failures: If the build fails, the code coverage tab appears with an appropriate message.
VSTest task configuration: When you use the VSTest task, if you don't enable code coverage check or if you mention incorrect DLLs or incorrect paths to test files in the Test filter field, coverage data don't display.
Build configuration issues: Sometimes multiple build configuration values exist and you don't set all values like BuildFlavour or BuildPlatform. The UI shows only values of particular build configurations, which is why other modules are missing.
Large HTML files: If the
.htmlfile is larger than 7 MB, the report isn't available in the Code Coverage tab. As a workaround, download the "Code Coverage Report_*" artifact from the published artifacts in the Summary.Failure messages: If the Code Coverage tab contains a failure message related to a user-specific error, investigate what triggered that error message.
What should I do if the Code Coverage Status Check never completes or fails?
To enable the code coverage status check, try adding the azurepipelines-coverage.yml file in the root of the repository. Ensure the file name remains exactly the same. Here's an example:
coverage:
  status:
    comments: on
    diff:
      target: 50%
If the coverage status check is failing:
- Check the diff coverage percentage. If it's smaller than the target, try to increase the diff coverage percentage.
- If the build failed for any reason, this failure can also cause the code coverage status check to fail.
- Check which task generates the coverage file or report in the pipeline. Verify if the task is properly uploading the coverage report or file.
- Cases where diff coverage comments show "No Executable changes" or "No code coverage data found" can occur due to lines being removed, whitespace introductions, or comment additions. These cases are nonexecutable changes and aren't significant, so code coverage doesn't report them.
How can I exclude some DLLs from code coverage?
To exclude files from code coverage, use the ExcludeFromCodeCoverageAttribute Class.
How do I publish the code coverage summary with proper details by merging multiple summary files?
The Publish Code Coverage V1 task doesn't support multiple summary files as input. Instead, use the Publish Code Coverage V2 task, which supports multiple file formats.
You can also use the Report Generator task to merge all .xml files and then pass the generated XML path as input to the Publish Code Coverage task.
How do I get the code coverage check triggered?
For .html files, coverage status checks aren't supported. Use the Build Quality Checks task to check code coverage results.
The report on the Code Coverage tab contains inaccurate numbers
The data displayed on the tab comes from the coverage file. If you're using custom tasks to generate the code coverage file, check if the file is missing any DLLs or files.
The code coverage policy is stuck—what causes this?
Several factors can cause this issue:
Incorrect branch policy name format: Verify the pipeline name matches the branch policy name and has no extra characters.

Using PublishCodeCoverage V1: The code coverage policy gets stuck and comments aren't generated. Use the PublishCodeCoverage V2 task instead.
Too many files in PR: If the PR has more than 100 files, the coverage policy gets stuck.
Multiple coverage policies: If you configure multiple coverage policies, one of them gets stuck. Configure only one policy and delete the other stuck policy.
I see 0% diff coverage for my PRs even after adding tests
If you add tests to cover modified or new lines of code in a PR and still see 0% diff coverage:
- Verify that the newly added tests run as part of the build.
- If tests don't run, verify and update the configuration to include them in the build, as coverage can't be calculated if tests don't run.
I don't see the diff coverage comment on PR even though I see the coverage report being published
Several factors can cause this issue:
- Task version: Diff coverage comments are supported only with Publish Code Coverage V2.
- No executable changes: Diff coverage comments are generated for files with executable code changes. If the PR only has configuration updates, Azure DevOps might show code coverage based on all tests run during the build, but there might not be any diff coverage to calculate.
- Coverage format: If there are functional code changes and the comment doesn't generate, verify that the pipeline generates a coverage report in one of the supported formats mentioned at the beginning of this article.
In the Code Coverage tab, I don't see the right HTML report
When there are problems generating the .html report, the system falls back to a simplified view.

Which coverage tools and result formats can be used for validating code coverage in pull requests?
Currently, you can only use Visual Studio Code coverage (.coverage) formats to validate code coverage for pull requests. Use this format if you publish code coverage by using the Visual Studio Test task, the test verb of the .NET Core task, and the TRX option of the Publish Test Results task.
If multiple pipelines are triggered when a pull request is raised, will coverage get merged across the pipelines?
If multiple pipelines are triggered when a pull request is raised, code coverage doesn't merge. This capability is currently designed for a single pipeline that collects and publishes code coverage for pull requests. If you need to merge coverage data across pipelines, submit a feature request on Developer Community.