Note
Access to this page requires authorization. You can try signing in or changing directories.
Access to this page requires authorization. You can try changing directories.
A Log Analytics workspace stores log data in tables. Each table is a collection of columns that define the shape of the data, and each row is a log record. Table configuration controls how data is collected, what the schema looks like, how long data is retained, and how much it costs to store and query. This article explains the key concepts behind tables in Azure Monitor Logs.
The following diagram shows the main configuration options for a table:
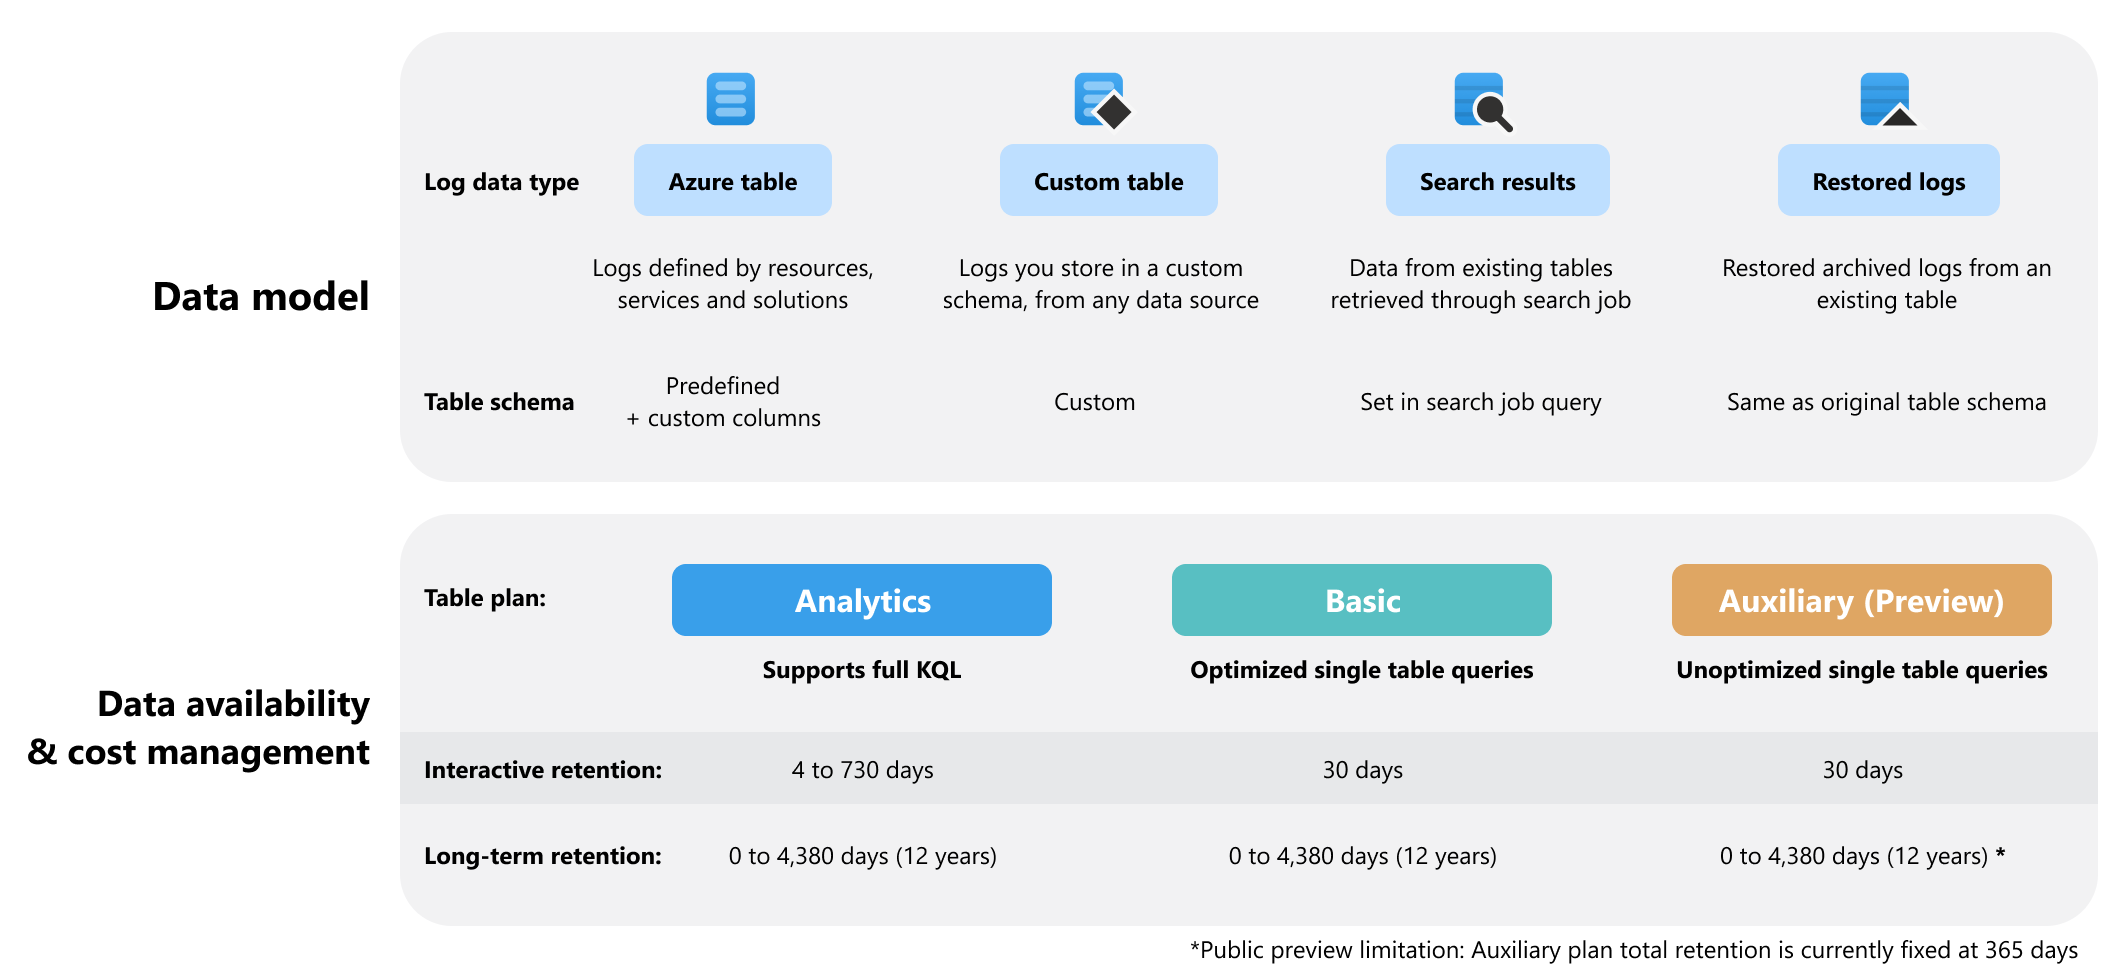
Table types
A Log Analytics workspace contains tables of several types. The table type determines the data source, how the schema is defined, and whether you can modify the schema.
| Table type | Data source | Schema |
|---|---|---|
| Azure table | Logs from Azure resources or required by Azure services and solutions | Azure Monitor Logs creates Azure tables automatically based on Azure services you use and diagnostic settings you configure for specific resources. Each Azure table has a predefined schema. You can add custom columns to store transformed or enriched data. |
| Custom table | Non-Azure resources and any other data source, such as file-based logs | You define the schema based on the data you collect. See Add or delete tables and columns in Azure Monitor Logs. |
| Search results | All data stored in a Log Analytics workspace | The schema is based on the query you define when you run the search job. You can't edit the schema of existing search results tables. |
| Restored logs | Data stored in a specific table in the workspace | A restored logs table has the same schema as the source table from which you restore logs. You can't edit the schema of existing restored logs tables. |
Table plans
Configure a table's plan based on how often you access the data in the table and what query capabilities you need:
| Table plan | Recommended use case |
|---|---|
| Analytics | Continuous monitoring, real-time detection, and performance analytics. This plan makes log data available for interactive multi-table queries and use by features and services for 30 days to two years. |
| Basic | Troubleshooting and incident response. This plan offers discounted ingestion and optimized single-table queries for 30 days. |
| Auxiliary | Low-touch data, such as verbose logs, and data required for auditing and compliance. This plan offers low-cost ingestion and unoptimized single-table queries for the entire retention period. |
For full details about table plans, see Azure Monitor Logs table plans.
Retention
Each table has two retention stages:
| Table retention stage | Description |
|---|---|
| Interactive retention | The period during which data is available for queries, alerts, and other Azure Monitor features. Interactive retention ranges from 4 to 730 days for Analytics tables, and is fixed at 30 days for Basic and Auxiliary tables. |
| Long-term retention | A low-cost extension that keeps data in your workspace for compliance or occasional investigation without making it available for continuous queries. To access data in long-term retention, run a search job. |
Use table-level retention settings to set both stages independently per table.
To access data in long-term retention, run a search job. Search jobs are a type of on-demand query that run against the entire dataset in a workspace, including data in long-term retention. For more information, see Search jobs in Azure Monitor Logs.
Ingestion-time transformations
Before log data reaches a table, you can use data collection rules to filter out unwanted records and transform data to match your table schema. Transformations run at ingestion time, so only the processed data is stored, which reduces costs and simplifies downstream queries.
For more information, see Data collection transformations in Azure Monitor.
Table schema
A table's schema is the set of columns that define what data the table can hold. The schema includes column names and data types.
Column data types
The following data types are supported for columns in a Log Analytics workspace table, as reported by the Tables API:
| Type | Description |
|---|---|
string |
Text value |
int |
32-bit integer |
long |
64-bit integer |
real |
Double-precision floating-point number |
boolean |
True or false |
dynamic |
JSON object or array |
datetime |
Date and time value |
guid |
GUID values are stored and queried as string |
Data collection rules (DCRs) support data types in their stream declarations, but don't support guid types. Azure Monitor Logs stores GUID values as the string type. The guid label that appears is a logical type annotation only, and it behaves identically to string for all ingestion and query operations.
You don't need a transformKql expression to convert GUID values to strings. Azure Monitor Logs writes GUID values as strings regardless of how the source data serializes them.