Note
Access to this page requires authorization. You can try signing in or changing directories.
Access to this page requires authorization. You can try changing directories.
The Agent details view in Application Insights provides a unified experience for monitoring AI agents across multiple sources, including Microsoft Foundry, Copilot Studio, and third-party agents.
This feature consolidates telemetry and diagnostics, enabling you to track agent performance, analyze token usage and costs, troubleshoot errors, and optimize your agent's behavior.
Note
Azure Monitor Agent Observability is based on OpenTelemetry Generative AI Semantics.
Prerequisites
Before you can use the Agents details view, implement AI agent data collection.
Monitor your AI agents
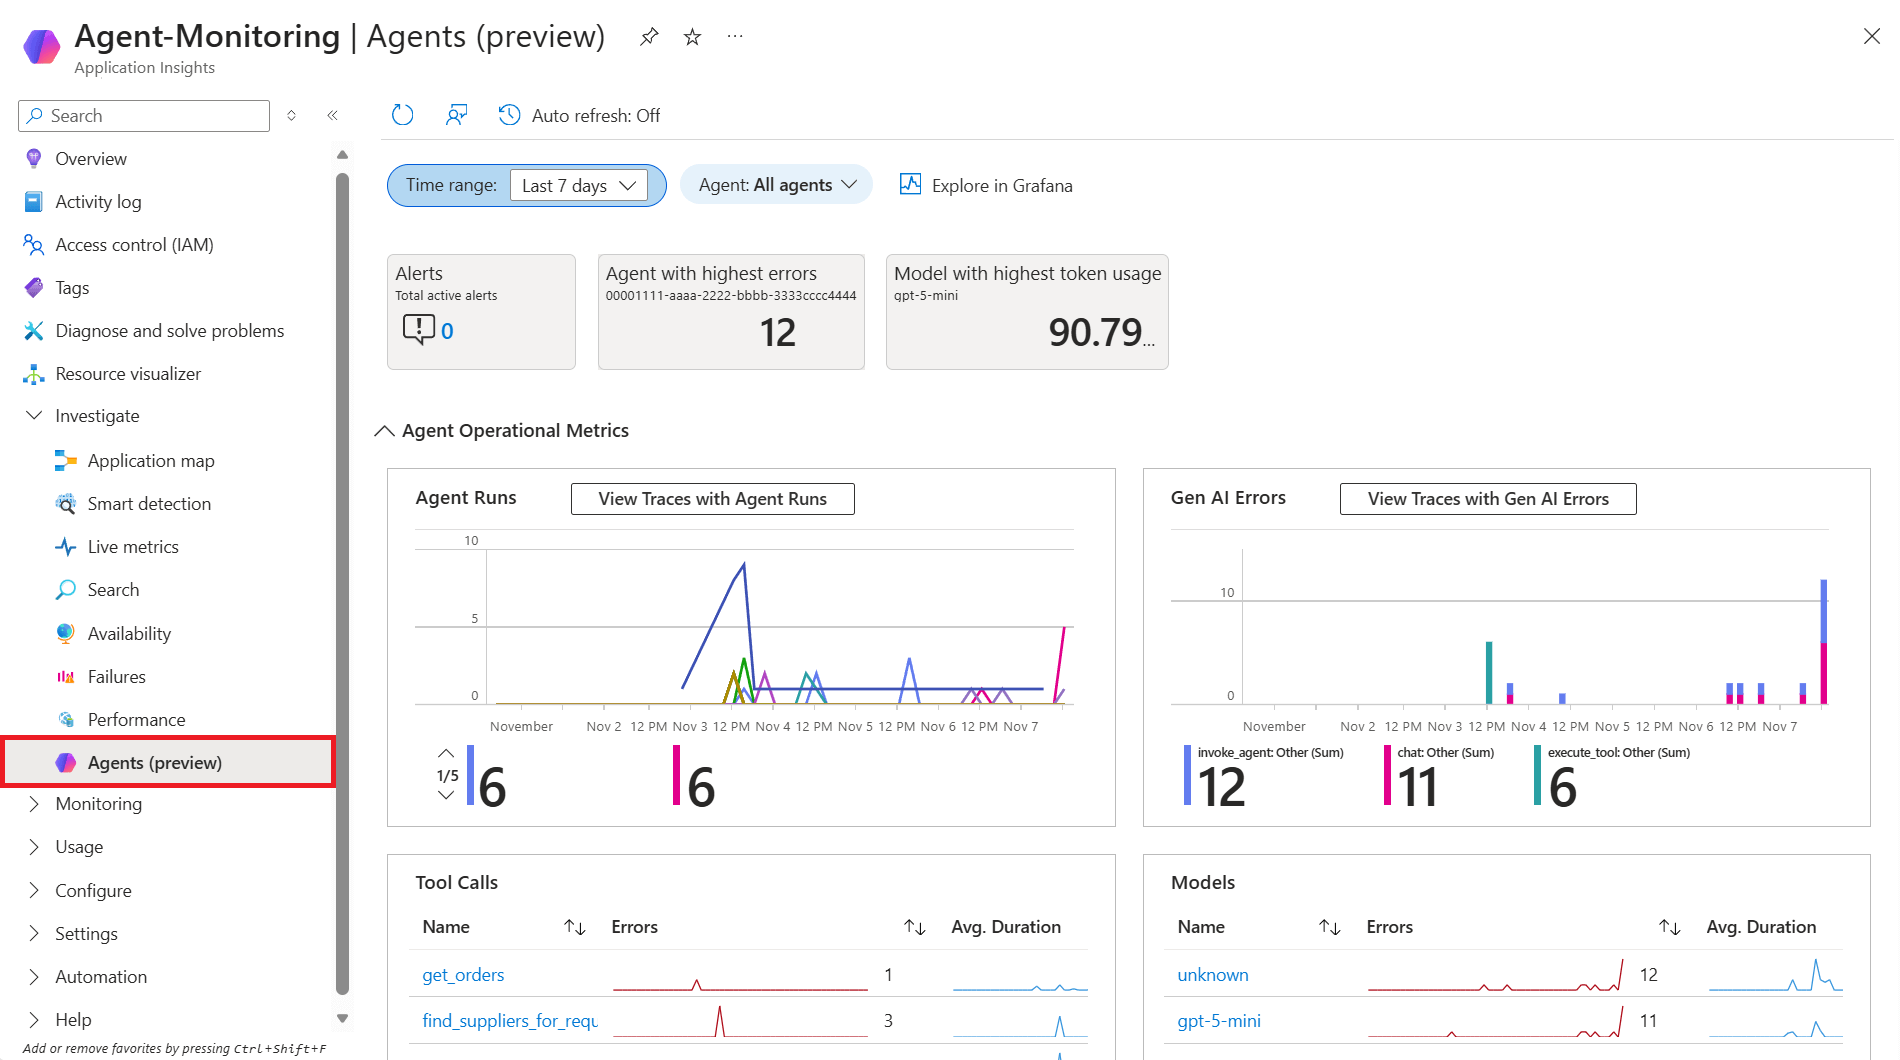
Access the Agent details view
After telemetry flows to Application Insights:
In the Azure portal, go to your Application Insights resource.
In the navigation menu, select Agents (Preview).

Note
You can also get to the Agent details view from Foundry. From your agent, go to the Monitoring tab, and then select View in Azure Monitor.
Investigate traces
To explore specific agent runs:
Select an option from the Agent details view:
- View Traces with Agent Runs - See all agent executions.
- View Traces with Gen AI Errors - Focus on failed or problematic runs.
- Any individual tool call or model in the Tool Calls or Models tiles.
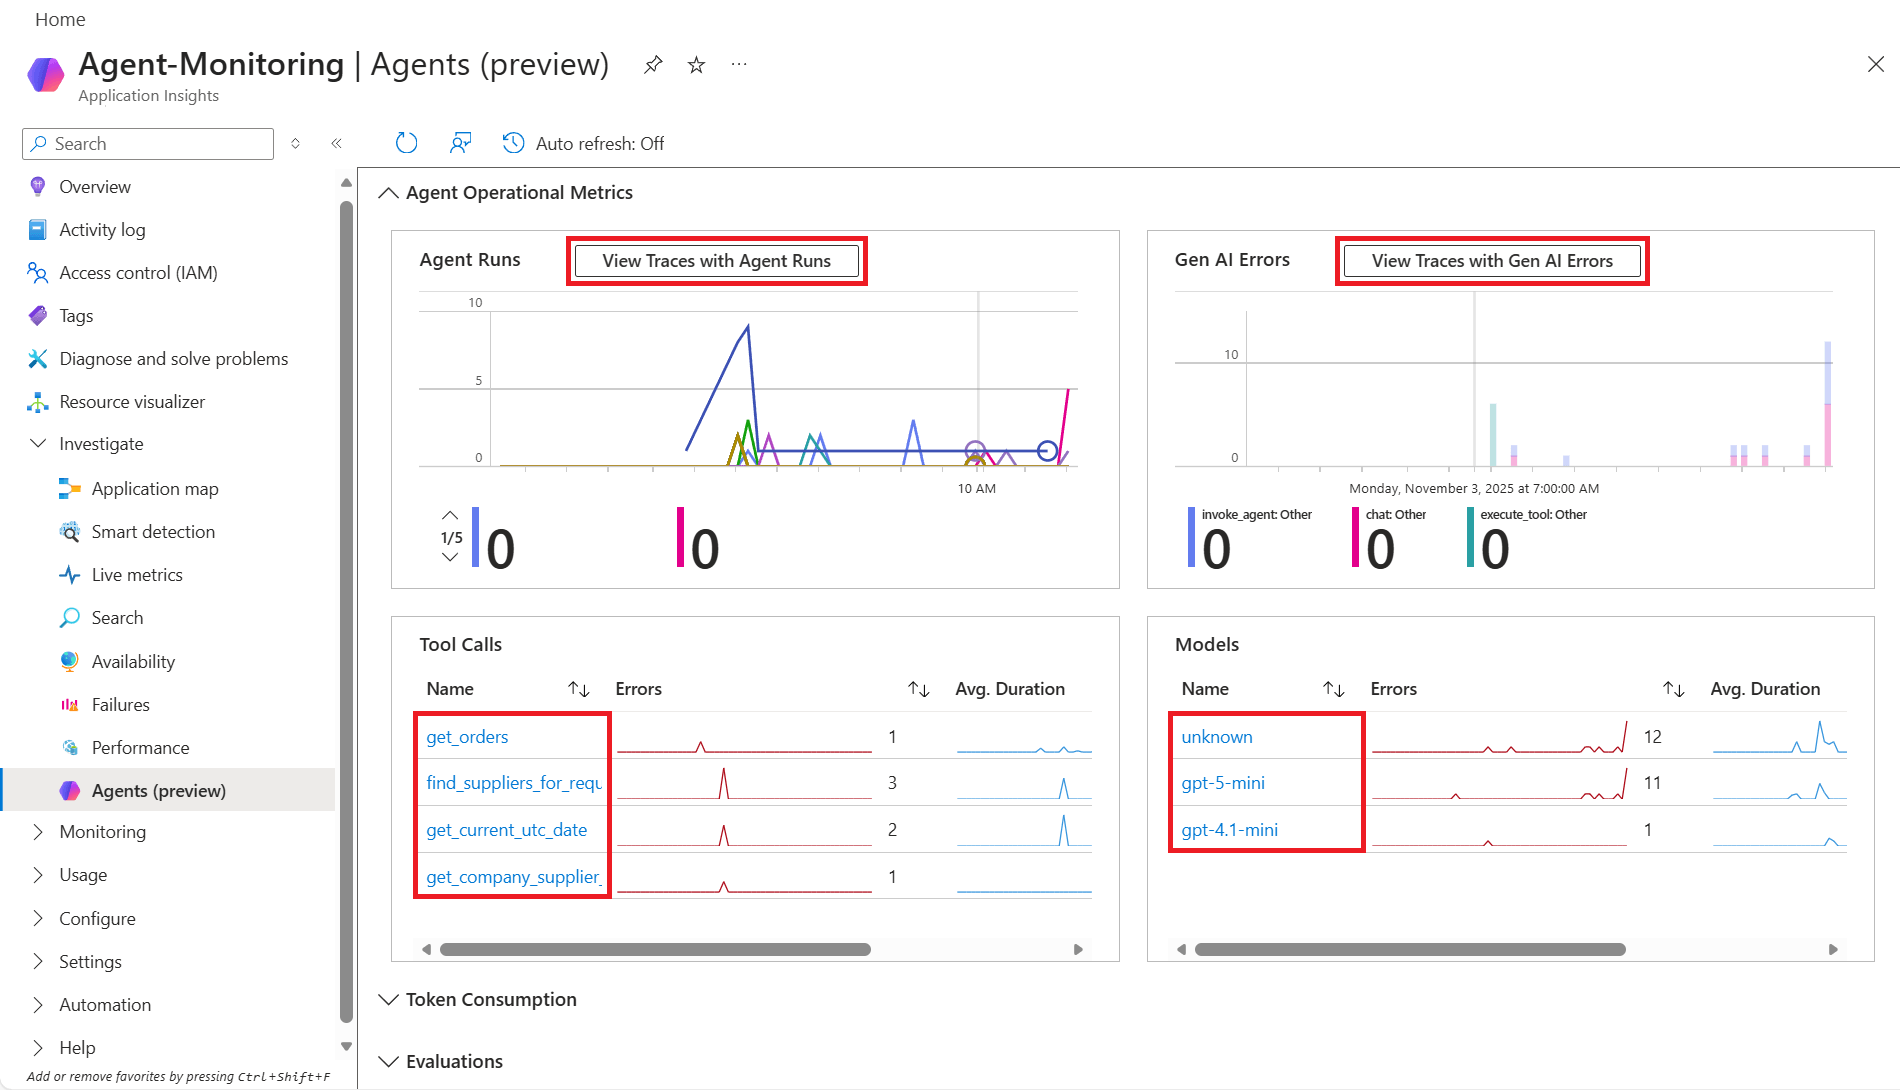
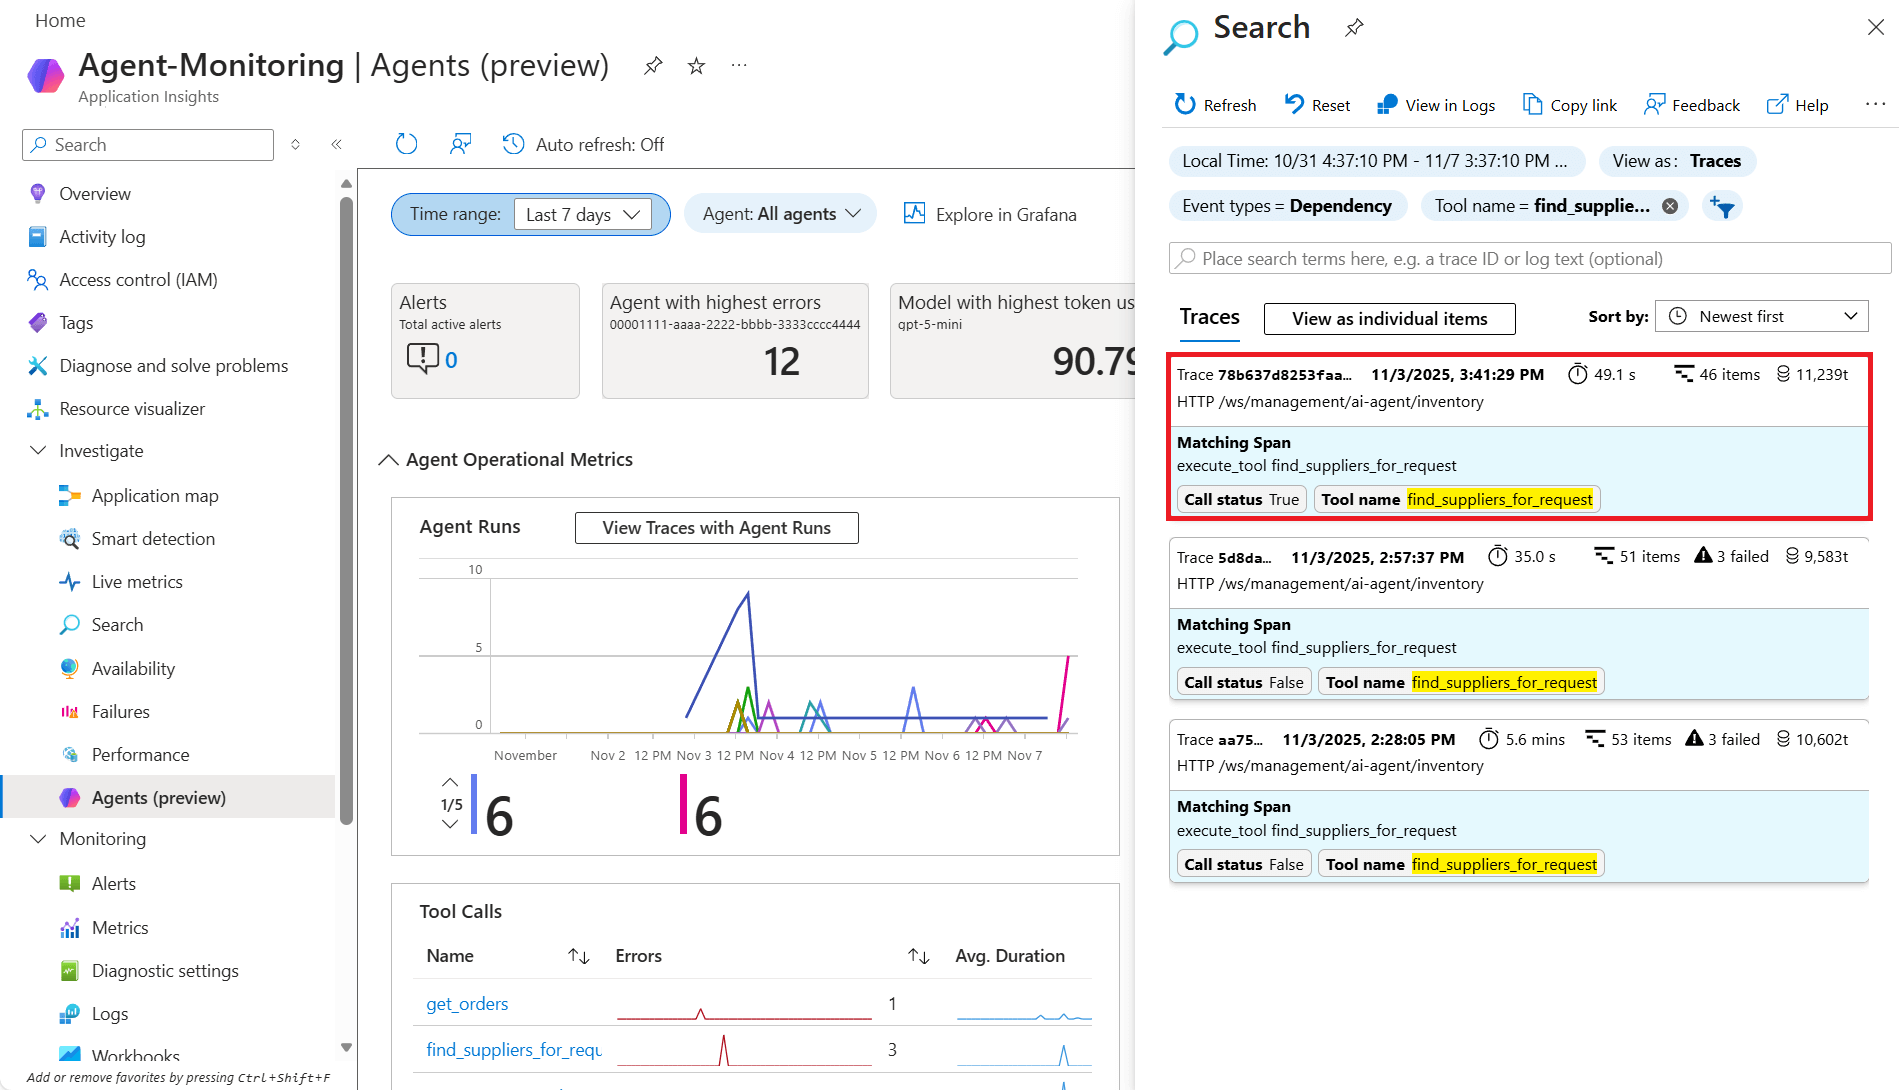
The Search overlay displays filtered traces that match your selection.
Use the search capabilities to:
- Sort traces by metrics such as Most tokens used to identify expensive operations.
- Filter by time range to isolate specific incidents.
- Search through prompt content if sensitive data logging is enabled.
Select any trace to access the End-to-end transaction details view for comprehensive analysis.


End-to-end transaction details view
The end-to-end transaction details view now offers a simple view. This view shows agent steps in a clear, story-like fashion, including the invoked agent, underlying large language model (LLM), executed tools, and more.
Simple view helps you quickly find the relevant telemetry and transition to Foundry or other tools to make the necessary changes.
Note
To return to the traditional view, select Leave simple view in the top action bar.

In this example, you research high token use. Transaction details help you identify that large prompt context and an expensive model drive up token use and costs.
Customize monitoring views with Grafana
The Agent details view in Application Insights provides an opinionated, out-of-the-box experience for monitoring your AI agents. For more advanced customization and visualization needs, select Explore in Grafana from the top navigation bar on the Agent details view.
Azure Monitor includes prebuilt Grafana dashboards designed for Gen AI monitoring to help you get started:
- Agent Framework - Monitor agent execution and performance
- Agent Framework workflow - Track agent workflow patterns and dependencies
- Foundry - Visualize Foundry-specific metrics and telemetry
- Coding agent dashboards - Monitor AI coding agent usage, performance, and cost. See Monitor AI coding agents.

These dashboards serve as a starting point for your monitoring strategy. You can customize them by:
- Using different visualization panels to match your preferences
- Editing or creating new queries to surface specific metrics
- Using Save as to create tailored dashboards for your specific environment and use cases
To learn more about using Grafana with Application Insights, see Dashboards with Grafana in Application Insights and Use Azure Monitor Dashboards with Grafana.
Monitor AI coding agents
AI coding agents such as GitHub Copilot, Claude Code, Codex, OpenClaw, Gemini CLI, and OpenCode emit OpenTelemetry Protocol (OTLP) signals that route into Application Insights for usage, cost, and reliability visibility.
How coding agent telemetry reaches Azure Monitor
Configure coding agents or IDEs to export OTLP signals by using organization-wide environment variables, project settings, or shared repository configurations.
Note
Ensure that your OTLP export configuration matches your organization's privacy and data handling policies. These settings determine whether content and conversation details are captured and exported.
An OpenTelemetry Collector receives the OTLP data and forwards it to Azure Monitor by using the Azure Monitor exporter. For end-to-end setup, see Monitor AI coding agents with Grafana.
When the data is in Azure Monitor, you can investigate usage and adoption patterns in Application Insights agent views and visualize trends with prebuilt coding agent dashboards.
Prebuilt Grafana dashboards for coding agents
Azure Monitor includes ready-to-use Grafana dashboards for coding agent monitoring:

You can find these dashboards in Dashboards with Grafana in Application Insights and in Azure Managed Grafana.
Related resources
Next steps
- Explore the end-to-end transaction diagnostic experience that correlates server-side telemetry from across all your Application Insights-monitored components into a single view.