Note
Access to this page requires authorization. You can try signing in or changing directories.
Access to this page requires authorization. You can try changing directories.
Dashboards with Grafana in Application Insights integrates Azure Monitor’s Grafana experience directly into the Azure portal. You create and customize Grafana dashboards by using your Application Insights data without running your own Grafana instance or using a separate managed Grafana service. Built‑in Grafana controls support a wide range of visualization panels and client‑side transformations across metrics, logs, and traces.
Key capabilities
Start from Azure-managed dashboards.
Use prebuilt dashboards for common Application Insights scenarios.Create and edit dashboards.
Add panels, modify queries, and apply client-side transformations.Save and share as Azure resources.
Store dashboards as standard Azure resources with Azure role-based access control (RBAC) and automate with Azure Resource Manager (ARM) or Bicep.Import from the Grafana community.
Bring in dashboards that use Azure Monitor, Azure Monitor managed service for Prometheus, or Azure Data Explorer data sources.Explore data ad-hoc.
Use Grafana Explore to run queries and add the results to new or existing dashboards.
Prerequisites
- An Application Insights resource.
- Permissions to read Application Insights data and create resources in the target subscription and resource group. Use Azure RBAC to assign access to dashboard resources after you save them.
Open the Grafana experience in Application Insights
- In the Azure portal, open your Application Insights resource.
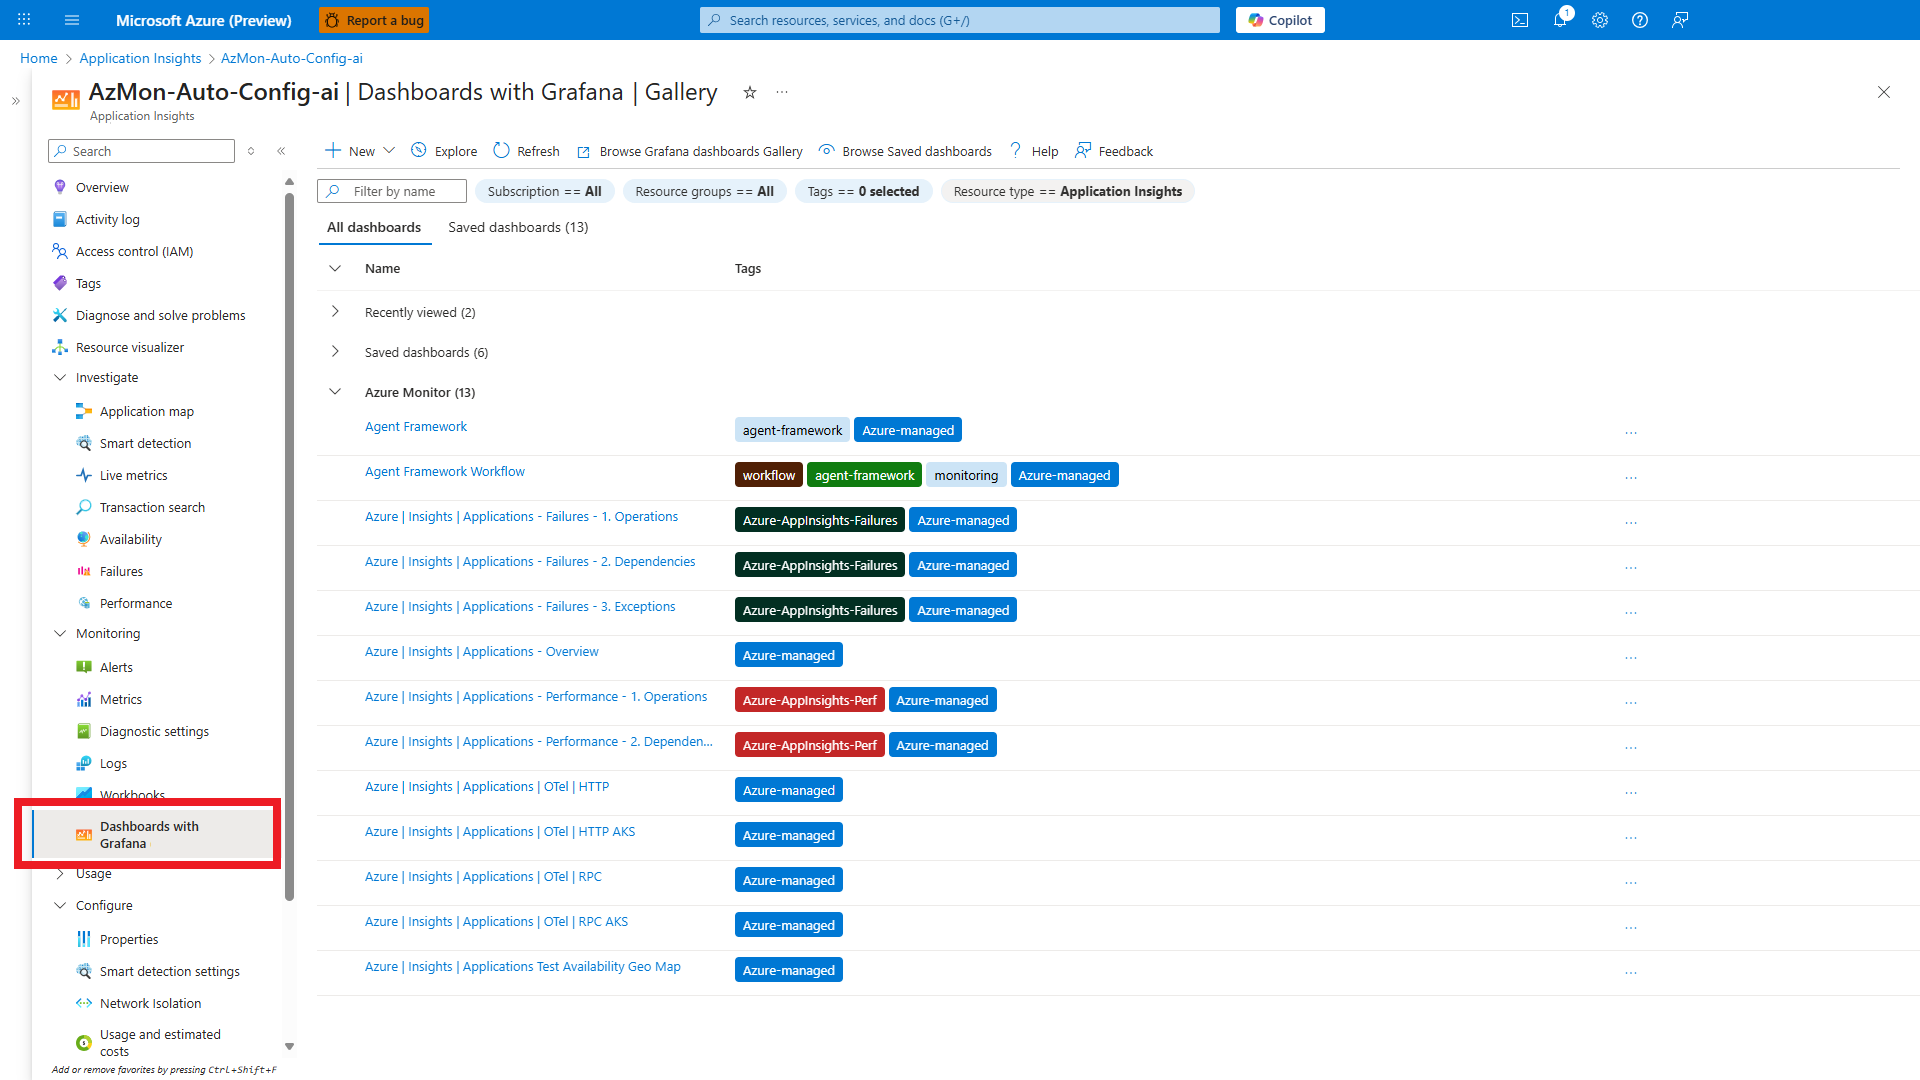
- In the left menu, select Dashboards with Grafana.
The gallery lists Azure‑managed dashboards and your Saved dashboards for the current Application Insights resource.
The gallery automatically filters to dashboards created for Application Insights. This filter is applied by default and can’t be changed when you use Dashboards with Grafana within Application Insights.
Start quickly with prebuilt dashboards
Azure provides several Azure‑managed dashboards that focus on Application Insights data. The gallery in Application Insights includes dashboards such as:
- Azure | Insights | Applications – Overview
- Azure | Insights | Applications – Performance – Operations
- Azure | Insights | Applications – Performance – Dependencies
- Azure | Insights | Applications – Failures – Operations
- Azure | Insights | Applications – Failures – Dependencies
- Azure | Insights | Applications | OTel (OpenTelemetry)
- Agent Framework dashboards for generative AI applications instrumented with the Microsoft Agent Framework
To view a dashboard, select the dashboard name from the list.
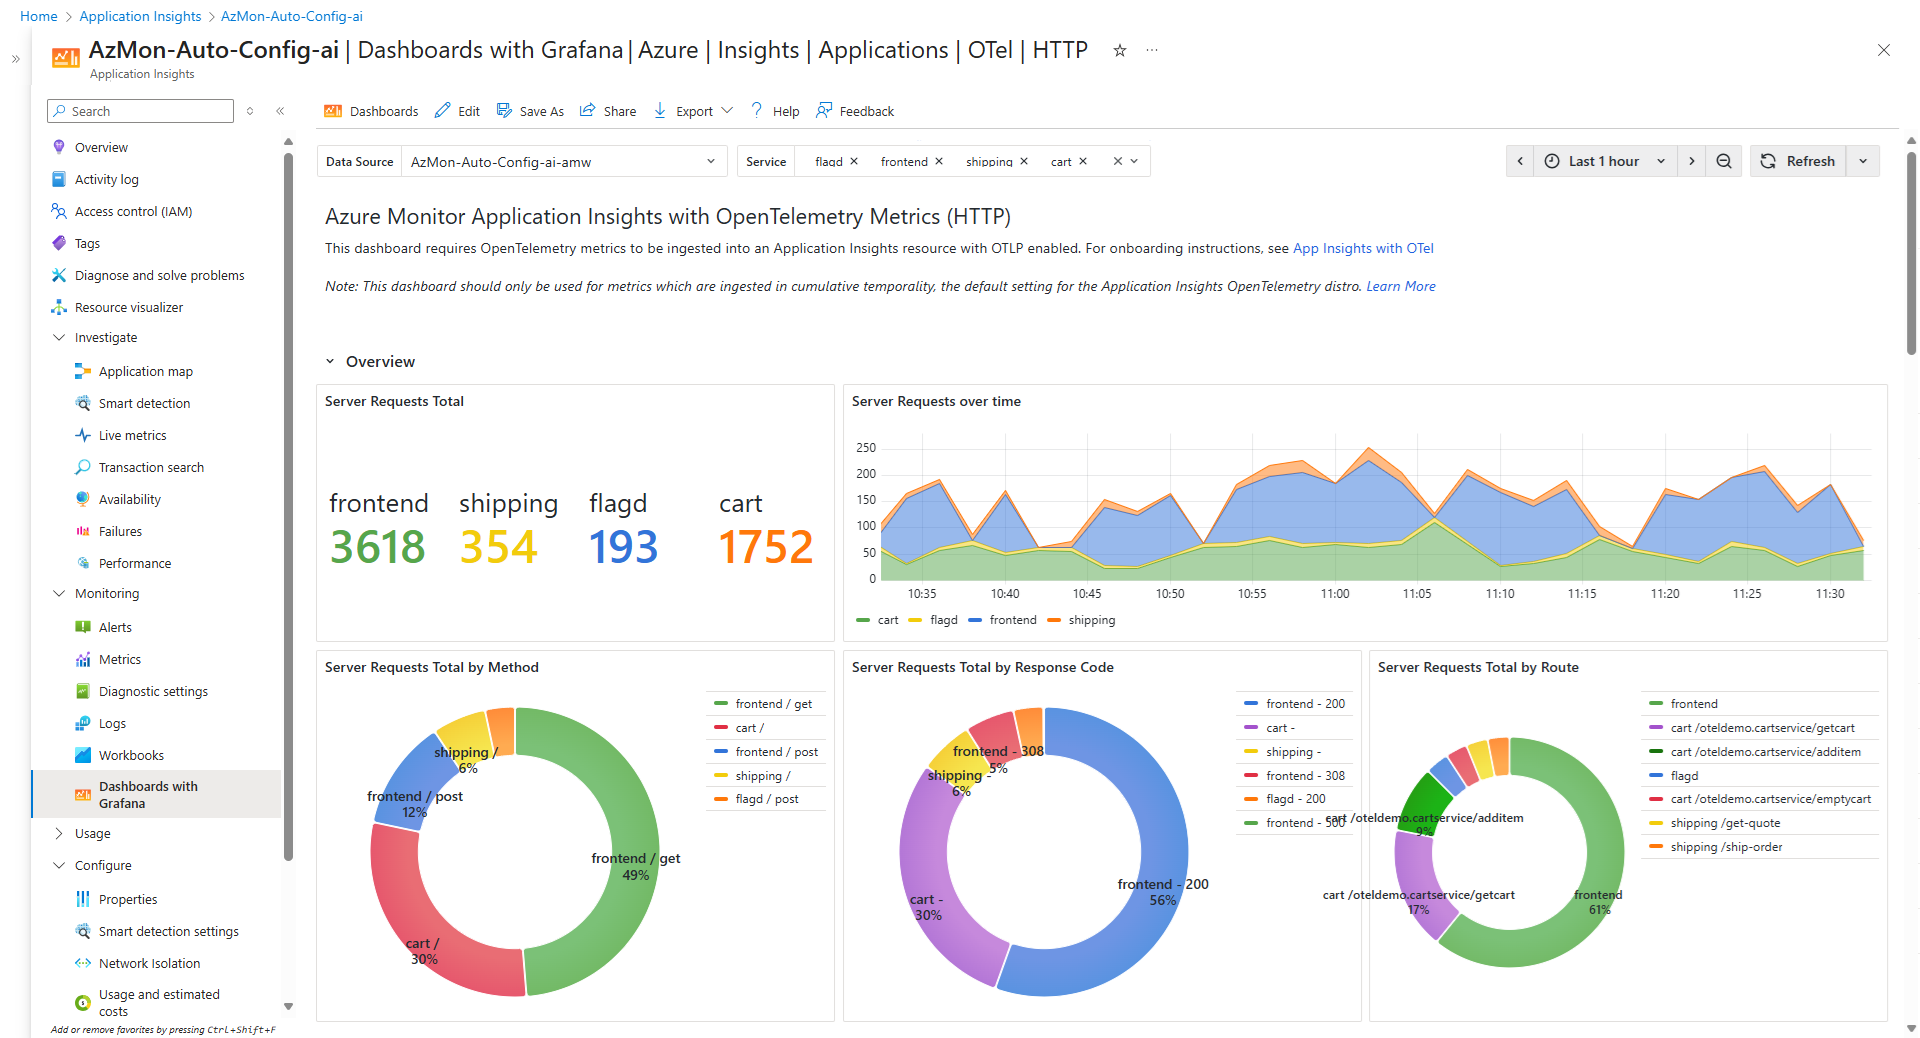
Example of an OpenTelemetry‑focused dashboard:
Create, edit, and save dashboards
You can customize any Azure-managed dashboard or start from a blank dashboard.
Edit an Azure-managed dashboard.
Open the dashboard and select Edit. Modify panels, queries, and transformations.Save a copy.
Select Save As to save your changes as a new dashboard. Choose a subscription, resource group, and name.Start from scratch.
In the gallery, select New to create a dashboard and add panels.
Every saved dashboard is an Azure resource. You manage it with Azure RBAC, export an ARM template, and add the dashboard to automation pipelines.
Note
Dashboards created within an Application Insights resource are automatically tagged so that they appear in the Application Insights Grafana gallery.
Use Grafana Explore
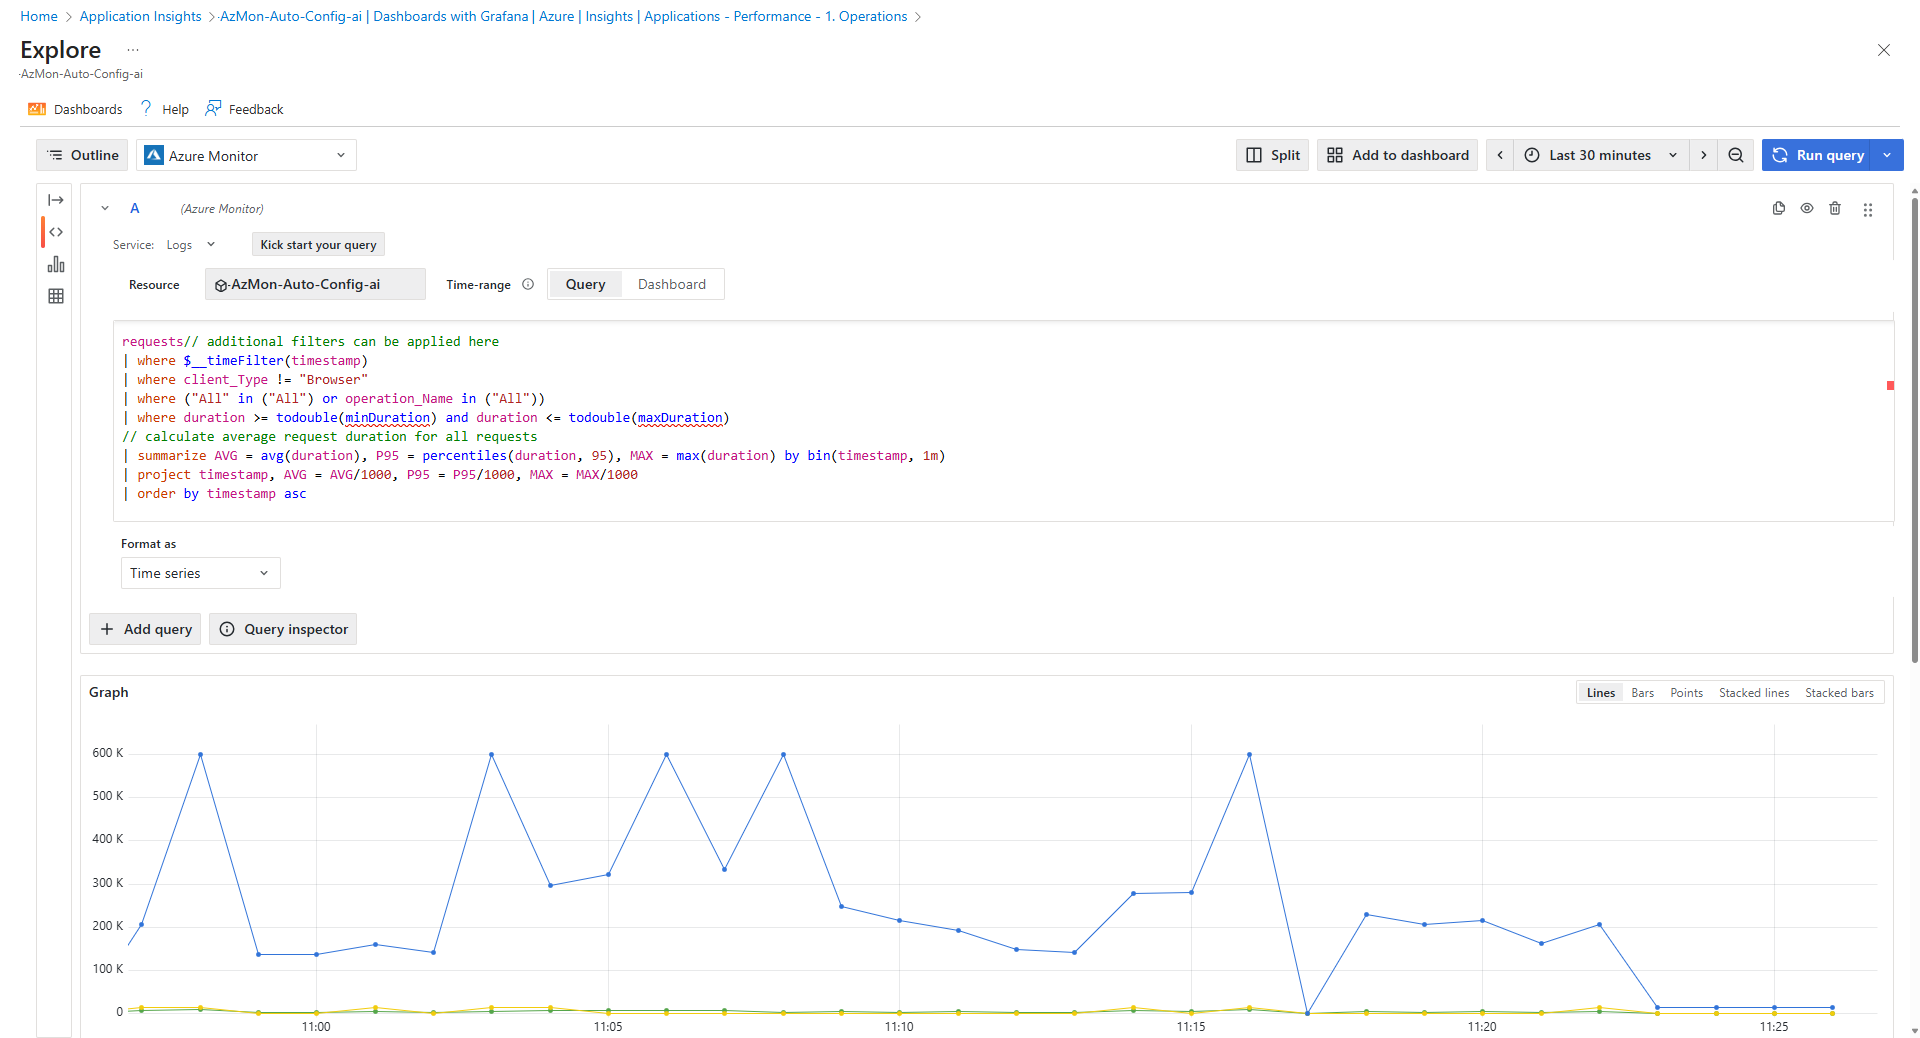
Grafana Explore helps you run ad‑hoc queries without starting inside a dashboard. You can add the results to a new or existing dashboard.
- From the top menu of the Grafana experience, select Explore.
- Choose a data source and build queries for the desired time range.
- Select Add to dashboard to turn the visualization into a panel.
Import dashboards from the Grafana community
You can import dashboards from the Grafana public gallery that rely on Azure data sources:
- Azure Monitor: metrics, logs, traces, alerts, and Azure Resource Graph
- Azure Monitor managed service for Prometheus: Prometheus metrics
- Azure Data Explorer: Kusto Query Language (KQL) queries
To import a dashboard:
- In Dashboards with Grafana, select Browse Grafana dashboards Gallery.
- Choose a dashboard and copy the Dashboard ID.
- Return to Dashboards with Grafana and select New.
- Select Import and follow the prompts.
The imported dashboard is saved as an Azure resource.
Important
The Application Insights Grafana experience supports Azure data sources only. Use Azure Managed Grafana if you need non‑Azure data sources or other Grafana enterprise features.
Ensure dashboards show in Application Insights
Dashboards visible in Dashboards with Grafana inside an Application Insights resource use a specific resource tag:
- Name:
GrafanaDashboardResourceType - Value:
microsoft.insights/components
Dashboards you create inside an Application Insights resource receive this tag automatically. If you import or create a dashboard outside the resource and want it to appear in the Application Insights gallery, add the tag manually:
- Open the dashboard resource.
- Select Tags and add the name and value.
- Save the changes.
After you add the tag, refresh the gallery in the Application Insights resource. The dashboard appears under Saved dashboards.
Manage access and automate at scale
Control access with Azure RBAC.
Assign roles at the dashboard resource, resource group, or subscription scope.Automate with ARM or Bicep.
Export an ARM template from a dashboard and use it to deploy consistently across environments.Use portal language settings.
The Grafana user interface honors the language you set in the Azure portal.
Costs
Dashboards with Grafana in Application Insights has no additional cost for the Grafana experience. Standard charges for Azure Monitor, Azure Monitor managed service for Prometheus, and Azure Data Explorer apply when queries run or data is stored.
Limitations
Supports Azure data sources only.
Azure Monitor, Azure Monitor managed service for Prometheus, and Azure Data Explorer.Dashboard visibility.
Dashboards appear in the Application Insights Grafana gallery only when theGrafanaDashboardResourceType=microsoft.insights/componentstag is present.
Troubleshooting
A dashboard doesn’t appear in the gallery.
Confirm the dashboard resource has the
GrafanaDashboardResourceTypetag with valuemicrosoft.insights/components. Refresh the gallery after you add the tag.
You can’t save a dashboard.
Verify you have permissions to create resources in the target subscription and resource group.
Data doesn’t load.
Check that the Application Insights resource and the selected data source contain data for the time range.
Next steps
- Learn more about visualizing with Grafana
- Instrument with the Microsoft Agent Framework.
- Secure your environment with Azure role‑based access control (RBAC).
- Build ARM or Bicep templates.


