Note
Access to this page requires authorization. You can try signing in or changing directories.
Access to this page requires authorization. You can try changing directories.
Applies to: ✔️ AKS Automatic ✔️ AKS Standard
AKS monitoring requires multiple levels of observability across platform metrics, Prometheus metrics, activity logs, resource logs, and container insights. AKS provides built-in monitoring capabilities and integrates with Azure Monitor, Container insights, managed service for Prometheus, and Azure Managed Grafana for comprehensive cluster health and performance monitoring.
For most production workloads, AKS Automatic is the recommended production-ready default for AKS. AKS Automatic clusters include a preconfigured monitoring baseline with managed service for Prometheus for metrics collection, Container insights for log collection, and Azure Monitor dashboards with Grafana for visualization in the Azure portal. In AKS Standard, you can enable and configure the same monitoring capabilities based on your requirements.
Tip
You can use Azure Copilot to configure monitoring on your AKS clusters in the Azure portal. For more information, see Work with AKS clusters efficiently using Azure Copilot.
Insights
Some services in Azure have a built-in monitoring dashboard in the Azure portal that provides a starting point for monitoring your service. These dashboards are called insights, and you can find them in the Insights Hub of Azure Monitor in the Azure portal.
AKS Automatic monitoring defaults
AKS Automatic provides a production-ready default experience for most AKS workloads. As part of that experience, AKS Automatic configures a default monitoring baseline for you.
| Monitoring capability | AKS Automatic | AKS Standard |
|---|---|---|
| Managed service for Prometheus | Default | Optional |
| Container insights | Default | Optional |
| Azure Monitor dashboards with Grafana | Default in the Azure portal | Default in the Azure portal |
| Azure Managed Grafana | Optional | Optional |
Use AKS Automatic when you want the recommended production-ready AKS experience with monitoring defaults already in place. Use AKS Standard when you want to choose and configure monitoring components individually.
For more information about AKS Automatic defaults, see What is Azure Kubernetes Service (AKS) Automatic?
AKS monitoring data: metrics, logs, integrations
AKS generates the same kinds of monitoring data as other Azure resources as described in Monitor data from Azure resources. For detailed information on the metrics and logs created by AKS, see the AKS monitoring data reference.
In AKS Automatic, the recommended default monitoring stack is already configured for you. In AKS Standard, you can assemble the same monitoring stack by enabling the relevant monitoring services and integrations.
Other Azure services and features collect other data and enable other analysis options as shown in the following diagram and table.

| Source | Description |
|---|---|
| Platform metrics | Platform metrics are automatically collected for AKS clusters at no cost. You can analyze these metrics using the metrics explorer or use them to create metric alerts. |
| Prometheus metrics | When you enable metric scraping for your cluster, the managed service for Prometheus in Azure Monitor collects Prometheus metrics and stores them in an Azure Monitor workspace. Analyze these metrics using prebuilt dashboards in Azure Managed Grafana and with Prometheus alerts. |
| Activity logs | The Azure Monitor activity log automatically collects some data for AKS clusters at no cost. These log files track information like when a cluster is created or changes are made to a cluster configuration. To analyze activity log data with your other log data, send activity log data to a Log Analytics workspace. |
| Resource logs | Control plane logs for AKS are implemented as resource logs. Create a diagnostic setting to send the logs to a Log Analytics workspace. In the workspace, you can analyze the logs using queries and set up alerts based on log information. |
| Container insights | Container insights collects various logs and performance data from a cluster and stores them in a Log Analytics workspace and in Azure Monitor metrics. Analyze data like stdout and stderr streams using views and workbooks in Container insights or Log Analytics and the metrics explorer. |
| Application Insights | Application Insights, a feature of Azure Monitor, collects logs, metrics, and distributed traces. The telemetry is stored in a Log Analytics workspace for analysis in the Azure portal. To enable Application Insights with code changes, see Enable Azure Monitor OpenTelemetry. To enable Application Insights without code changes, see AKS autoinstrumentation. For more information on instrumentation, learn about data collection basics. |
Resource types
Azure uses the concept of resource types and IDs to identify everything in a subscription. Resource types are also part of the resource IDs for every resource running in Azure. For example, one resource type for a virtual machine is Microsoft.Compute/virtualMachines. For a list of services and their associated resource types, see Resource providers.
Azure Monitor similarly organizes core monitoring data into metrics and logs based on resource types, also called namespaces. Different metrics and logs are available for different resource types. Your service might be associated with more than one resource type.
For more information about resource types in AKS, see the AKS monitoring data reference.
Data storage
For Azure Monitor:
- Metrics data is stored in the Azure Monitor metrics database.
- Log data is stored in the Azure Monitor logs store. Log Analytics is a tool in the Azure portal that can query this store.
- The Azure activity log is a separate store with its own interface in the Azure portal.
You can optionally route metric and activity log data to the Azure Monitor logs store. You can then use Log Analytics to query the data and correlate it with other log data.
Many services can use diagnostic settings to send metric and log data to other storage locations outside Azure Monitor. Examples include Azure Storage, hosted partner systems, and non-Azure partner systems, by using Event Hubs.
For detailed information on how Azure Monitor stores data, see Azure Monitor data platform.
Azure Monitor platform metrics
Azure Monitor provides platform metrics for most services. These metrics are:
- Individually defined for each namespace.
- Stored in the Azure Monitor time-series metrics database.
- Lightweight and capable of supporting near real-time alerting.
- Used to track the performance of a resource over time.
Collection: Azure Monitor collects platform metrics automatically. No configuration is required.
Routing: You can also route some platform metrics to Azure Monitor Logs / Log Analytics so you can query them with other log data. Check the DS export setting for each metric to see if you can use a diagnostic setting to route the metric to Azure Monitor Logs / Log Analytics.
- For more information, see the Metrics diagnostic setting.
- To configure diagnostic settings for a service, see Create diagnostic settings in Azure Monitor.
For a list of all metrics it's possible to gather for all resources in Azure Monitor, see Supported metrics in Azure Monitor.
For a list of metrics you can collect for AKS, see the AKS monitoring data reference.
Metrics play an important role in monitoring clusters, identifying issues, and optimizing performance in AKS clusters. Platform metrics are captured using the out-of-the-box metrics server installed in the kube-system namespace, which periodically scrapes metrics from all AKS nodes served by kubelet. You should also enable managed service for Prometheus metrics to collect container metrics and Kubernetes object metrics, including object deployment state.
In AKS Automatic, managed service for Prometheus is enabled by default, so you start with a production-ready metrics baseline without additional setup.
You can view the list of default managed service for Prometheus metrics.
For more information, see Collect managed service for Prometheus metrics from an AKS cluster.
Non-Azure Monitor based metrics
This service provides other metrics that aren't included in the Azure Monitor metrics database.
You can use the following Azure services and Azure Monitor features to monitor your AKS clusters. In AKS Automatic, the default monitoring baseline already includes managed service for Prometheus, Container insights, and Azure Monitor dashboards with Grafana. In AKS Standard, you can enable these features when you create a cluster or onboard the cluster later.
In the Azure portal, use the Integrations tab, or use the Azure CLI, Terraform, or Azure Policy. In some cases, you can onboard your cluster to a monitoring service or feature after you create the cluster. Each service or feature might incur cost, so see the pricing information for each component before you enable it.
| Service or feature | Description |
|---|---|
| Container insights | Uses a containerized version of the Azure Monitor Agent to collect stdout and stderr logs and Kubernetes events from each node in your cluster. The feature supports a variety of monitoring scenarios for AKS clusters. You can enable monitoring for an AKS cluster when it's created using the Azure CLI, Azure Policy, the Azure portal, or Terraform. If you don't enable Container insights when you create your cluster, see Enable Container insights for AKS cluster for other options to enable it.Container insights stores most of its data in a Log Analytics workspace. You typically use the same Log Analytics workspace as the resource logs for your cluster. For guidance on how many workspaces you should use and where to locate them, see Design a Log Analytics workspace architecture. |
| Managed service for Prometheus in Azure Monitor | Prometheus is a cloud-native metrics solution from the Cloud Native Computing Foundation. It's the most common tool to use to collect and analyze metric data from Kubernetes clusters. The managed service for Prometheus in Azure Monitor is a fully managed Prometheus-compatible monitoring solution. If you don't enable the managed service for Prometheus when you create your cluster, see Collect Prometheus metrics from an AKS cluster for other options to enable it. The managed service for Prometheus in Azure Monitor stores its data in an Azure Monitor workspace that is linked to a Grafana workspace. You can use Azure Managed Grafana to analyze the data. |
| Azure Managed Grafana | A fully managed implementation of Grafana. Grafana is an open-source data visualization platform commonly used to present Prometheus data. Multiple predefined Grafana dashboards are available for monitoring Kubernetes and full-stack troubleshooting. If you don't enable Azure Managed Grafana when you create your cluster, see Link a Grafana workspace. You can link it to your Azure Monitor workspace so that it can access Prometheus metrics from your cluster. |
AKS control plane metrics monitoring (preview)
Prerequisites and scope: This preview feature is available for AKS clusters running Kubernetes 1.27 or later and requires the managed service for Prometheus to be enabled on your cluster. The feature currently supports Linux and Windows node pools but is not compatible with Virtual Machine Availability Sets (VMAS).
AKS also exposes metrics from critical control plane components like the API server, etcd, and the scheduler through the managed service for Prometheus in Azure Monitor. Currently, this feature is in preview. For more information, see Monitor AKS control plane metrics. A subset of control plane metrics for the API server and etcd are available free through Azure Monitor platform metrics. These metrics are collected by default. You can use the metrics to create alerts.
Azure Monitor resource logs
Resource logs provide insight into operations that were done by an Azure resource. Logs are generated automatically, but you must route them to Azure Monitor logs to save or query them. Logs are organized in categories. A given namespace might have multiple resource log categories.
Collection: Resource logs aren't collected and stored until you create a diagnostic setting and route the logs to one or more locations. When you create a diagnostic setting, you specify which categories of logs to collect. There are multiple ways to create and maintain diagnostic settings, including the Azure portal, programmatically, and though Azure Policy.
Routing: The suggested default is to route resource logs to Azure Monitor Logs so you can query them with other log data. Other locations such as Azure Storage, Azure Event Hubs, and certain Microsoft monitoring partners are also available. For more information, see Azure resource logs and Resource log destinations.
For detailed information about collecting, storing, and routing resource logs, see Diagnostic settings in Azure Monitor.
For a list of all available resource log categories in Azure Monitor, see Supported resource logs in Azure Monitor.
All resource logs in Azure Monitor have the same header fields, followed by service-specific fields. The common schema is outlined in Azure Monitor resource log schema.
For the available resource log categories, their associated Log Analytics tables, and log schemas for AKS, see the AKS monitoring data reference.
AKS control plane resource logs
Prerequisites: Requires a Log Analytics workspace in the same subscription as your AKS cluster. Resource logs incur ingestion and retention costs in the destination workspace. For cost optimization, use resource-specific mode and configure Basic logs tier for audit tables.
Control plane logs for AKS clusters are implemented as resource logs in Azure Monitor. Resource logs aren't collected and stored until you create a diagnostic setting to route them to at least one location. You typically send resource logs to a Log Analytics workspace, where most data for Container insights is stored.
To learn how to create a diagnostic setting using the Azure portal, the Azure CLI, or Azure PowerShell, see Create diagnostic settings. When you create a diagnostic setting, you specify which categories of logs to collect. The categories for AKS are listed in the AKS monitoring data reference.
Warning
You can incur substantial cost when you collect resource logs for AKS, particularly for kube-audit logs. Consider the following recommendations to reduce the amount of data collected:
- Disable
kube-auditlogging when not required. - Enable collection from
kube-audit-admin, which excludes thegetandlistaudit events. - Enable resource-specific logs as described in this article, and configure the AKSAudit table as Basic logs.
For more monitoring recommendations, see Monitor AKS clusters using Azure services and cloud-native tools. For strategies to reduce your monitoring costs, see Cost optimization and Azure Monitor.
AKS supports either Azure diagnostics mode or resource-specific mode for resource logs. Azure diagnostics mode sends all data to the AzureDiagnostics table. Resource-specific mode specifies the tables in the Log Analytics workspace where the data is sent. It also sends data to AKSAudit, AKSAuditAdmin, and AKSControlPlane as shown in the table in Resource logs.
We recommend that you use resource-specific mode for AKS for the following reasons:
- Data is easier to query because it's in individual tables that are dedicated to AKS.
- Resource-specific mode supports configuration as Basic logs for significant cost savings.
For more information on the difference between collection modes, including how to change an existing setting, see Select the collection mode.
Note
You can configure diagnostic settings using the Azure CLI. This approach isn't guaranteed to be successful because it doesn't check for the cluster's provisioning state. After you change diagnostic settings, check to be sure that the cluster reflects the setting changes.
az monitor diagnostic-settings create --name AKS-Diagnostics --resource /subscriptions/xxxxxxxx-xxxx-xxxx-xxxx-xxxxxxxxxxxx/resourceGroups/myresourcegroup/providers/Microsoft.ContainerService/managedClusters/my-cluster --logs '[{"category": "kube-audit","enabled": true}, {"category": "kube-audit-admin", "enabled": true}, {"category": "kube-apiserver", "enabled": true}, {"category": "kube-controller-manager", "enabled": true}, {"category": "kube-scheduler", "enabled": true}, {"category": "cluster-autoscaler", "enabled": true}, {"category": "cloud-controller-manager", "enabled": true}, {"category": "guard", "enabled": true}, {"category": "csi-azuredisk-controller", "enabled": true}, {"category": "csi-azurefile-controller", "enabled": true}, {"category": "csi-snapshot-controller", "enabled": true}]' --workspace /subscriptions/xxxxxxxx-xxxx-xxxx-xxxx-xxxxxxxxxxxx/resourcegroups/myresourcegroup/providers/microsoft.operationalinsights/workspaces/myworkspace --export-to-resource-specific true
AKS resource log queries and examples
Query scope requirements: When you select Logs on an AKS cluster menu, Log Analytics opens with the query scope set to the current cluster. Log queries include data only from that resource. To run queries that include data from other clusters or Azure services, select Logs from the Azure Monitor menu.
If the diagnostic settings for your cluster use Azure diagnostics mode, the resource logs for AKS are stored in the AzureDiagnostics table. Identify logs via the Category column. For a description of each category, see AKS reference resource logs.
| Description | Mode | Log query |
|---|---|---|
| Count logs for each category | Azure diagnostics mode | AzureDiagnostics| where ResourceType == "MANAGEDCLUSTERS"| summarize count() by Category |
| All API server logs | Azure diagnostics mode | AzureDiagnostics| where Category == "kube-apiserver" |
| All kube-audit logs in a time range | Azure diagnostics mode | let starttime = datetime("2023-02-23");let endtime = datetime("2023-02-24");AzureDiagnostics| where TimeGenerated between(starttime..endtime)| where Category == "kube-audit"| extend event = parse_json(log_s)| extend HttpMethod = tostring(event.verb)| extend User = tostring(event.user.username)| extend Apiserver = pod_s| extend SourceIP = tostring(event.sourceIPs[0])| project TimeGenerated, Category, HttpMethod, User, Apiserver, SourceIP, OperationName, event |
| All audit logs | Resource-specific mode | AKSAudit |
All audit logs excluding the get and list audit events |
Resource-specific mode | AKSAuditAdmin |
| All API server logs | Resource-specific mode | AKSControlPlane| where Category == "kube-apiserver" |
To access a set of prebuilt queries in the Log Analytics workspace, see the Log Analytics queries interface, and select the Kubernetes Services resource type. For a list of common queries for Container insights, see Container insights queries.
AKS audit policy
AKS uses a Kubernetes audit policy to control what events are logged and what data they contain. The policy defines rules that determine the audit level for different types of API requests based on users, resources, namespaces, and verbs. The following audit levels are used:
- None: Events matching this rule aren't logged.
- Metadata: Log request metadata (requesting user, timestamp, resource, verb) but not request or response body.
- Request: Log event metadata and request body but not response body.
- RequestResponse: Log event metadata, request and response bodies.
The following table summarizes the key audit policy rules applied in AKS:
| Audit level | Description | Example events |
|---|---|---|
| None | High-volume, low-risk read operations | aksService user get/list operations, kube-proxy watch on endpoints/services, kubelet get on nodes/node status, health check URLs (/healthz*, /version, /swagger*) |
| Metadata | System events, events resources (except creates/updates in default/kube-system), secrets, configmaps, service accounts, token reviews |
Token reviews, secret/configmap access, large CRDs like installations.operator.tigera.io |
| Request | Node and pod status updates from kubelets/nodes, delete collection operations, CRD updates for volume snapshots, read operations (get/list/watch) on core API groups, VPA changes |
Kubelet status updates, namespace deletions, VPA checkpoint updates |
| RequestResponse | CoreDNS custom configmap updates, Fleet API operations, Karpenter resource changes, all other write operations on core API groups | CoreDNS configuration changes, Fleet member cluster operations, Karpenter node pool changes |
The complete audit policy used in AKS is available for review in the following collapsible section.
View the complete AKS audit policy
apiVersion: audit.k8s.io/v1
kind: Policy
rules:
  # audit level 'None' for high volume and low risk events
  - level: None
    users: ["aksService"]
    verbs: ["get", "list"]
  # audit level 'None' for low-risk requests
  - level: None
    users: ["system:kube-proxy"]
    verbs: ["watch"]
    resources:
      - group: ""
        resources: ["endpoints", "services", "services/status"]
  # audit level 'None' for low-risk requests
  - level: None
    users: ["kubelet"] # legacy kubelet identity
    verbs: ["get"]
    resources:
      - group: ""
        resources: ["nodes", "nodes/status"]
  # audit level 'None' for low-risk requests
  - level: None
    userGroups: ["system:nodes"]
    verbs: ["get"]
    resources:
      - group: ""
        resources: ["nodes", "nodes/status"]
  # audit level 'None' for low-risk requests
  - level: None
    users:
      - aksService # the default user/cert used by aks in master node
      - system:serviceaccount:kube-system:endpoint-controller
    verbs: ["get", "update"]
    namespaces: ["kube-system"]
    resources:
      - group: ""
        resources: ["endpoints"]
  # audit level 'None' for low-risk requests
  - level: None
    users: ["system:apiserver"]
    verbs: ["get"]
    resources:
      - group: ""
        resources: ["namespaces", "namespaces/status", "namespaces/finalize"]
  # audit level 'None' for low-risk requests
  - level: None
    users:
      - aksService # the default user/cert used by aks in master node
    verbs: ["get", "list"]
    resources:
      - group: "metrics.k8s.io"
  # Don't log these read-only URLs.
  - level: None
    nonResourceURLs:
      - /healthz*
      - /version
      - /swagger*
  # monitor metadata for system events which are being logged by eventlogger component
  - level: Metadata
    verbs: ["create", "update", "patch"]
    resources:
      - group: ""
        resources: ["events"]
      - group: "events.k8s.io"
        resources: ["events"]
    namespaces: ["default", "kube-system"]
  # Monitoring of actions to detect security/performance relevant activities.
  - level: Metadata
    verbs: ["delete", "list"]
    resources:
      - group: ""
        resources: ["events"]
      - group: "events.k8s.io"
        resources: ["events"]
  # Don't log other events requests.
  - level: None
    resources:
      - group: ""
        resources: ["events"]
      - group: "events.k8s.io"
        resources: ["events"]
  # node and pod status calls from nodes are high-volume and can be large, don't log responses for expected updates from nodes
  - level: Request
    users: ["client", "kubelet", "system:node-problem-detector", "system:serviceaccount:kube-system:node-problem-detector", "system:serviceaccount:kube-system:aci-connector-linux"]
    verbs: ["update","patch"]
    resources:
      - group: ""
        resources: ["nodes/status", "pods/status"]
    omitStages:
      - "RequestReceived"
  # node and pod status calls from nodes are high-volume and can be large, don't log responses for expected updates from nodes
  - level: Request
    userGroups: ["system:nodes"]
    verbs: ["update","patch"]
    resources:
      - group: ""
        resources: ["nodes/status", "pods/status"]
    omitStages:
      - "RequestReceived"
  # deletecollection calls can be large, don't log responses for expected namespace deletions
  - level: Request
    users: ["system:serviceaccount:kube-system:namespace-controller"]
    verbs: ["deletecollection"]
    omitStages:
      - "RequestReceived"
  # ignore response object that has big size
  - level: Request
    verbs: ["update","patch"]
    resources:
      - group: "apiextensions.k8s.io"
        resources: ["customresourcedefinitions"]
        resourceNames: ["volumesnapshotcontents.snapshot.storage.k8s.io", "volumesnapshots.snapshot.storage.k8s.io"]
    omitStages:
      - "RequestReceived"
  # ignore request and response objects for large CRDs that will be filtered down anyway
  - level: Metadata
    resources:
      - group: "apiextensions.k8s.io"
        resources: ["customresourcedefinitions"]
        resourceNames: ["installations.operator.tigera.io"]
    omitStages:
      - "RequestReceived"
  # overriding the default behavior of coredns might have security threats for Kubernetes DNS in security perspective, set the level as RequestResponse
  - level: RequestResponse
    verbs: ["update","patch"]
    resources:
      - group: ""
        resources: ["configmaps"]
        resourceNames: ["coredns-custom"]
    namespaces: ["kube-system"]
    omitStages:
      - "RequestReceived"
  # Secrets, ConfigMaps, ServiceAccounts, TokenRequest and TokenReviews can contain sensitive & binary data,
  # so only log at the Metadata level.
  - level: Metadata
    resources:
      - group: ""
        resources: ["secrets", "configmaps", "serviceaccounts", "serviceaccounts/token"]
      - group: authentication.k8s.io
        resources: ["tokenreviews"]
    omitStages:
      - "RequestReceived"
  # Capture state of vertical pod autoscalers
  - level: Request
    verbs: ["create", "update", "patch", "delete"]
    resources:
      - group: "autoscaling.k8s.io"
        resources: ["verticalpodautoscalers", "verticalpodautoscalercheckpoints"]
    omitStages:
      - "RequestReceived"
  # Capture create and delete of internal fleet resources
  - level: RequestResponse
    verbs: ["create", "delete"]
    resources:
      - group: "cluster.kubernetes-fleet.io"
        resources: ["memberclusters", "internalmemberclusters"]
      - group: "placement.kubernetes-fleet.io"
        resources: ["works"]
      - group: "networking.fleet.azure.com"
        resources: ["internalserviceexports", "internalserviceimports"]
    omitStages:
      - "RequestReceived"
  # Capture CUD of user facing Fleet API
  - level: RequestResponse
    verbs: ["create", "update", "patch", "delete"]
    resources:
      - group: "placement.kubernetes-fleet.io"
        resources: ["clusterstagedupdateruns", "clusterresourceplacements", "clusterresourceplacementevictions", "clusterresourceplacementdisruptionbudgets", "clusterstagedupdatestrategies", "clusterapprovalrequests", "clusterresourceoverrides", "resourceoverrides"]
      - group: "networking.fleet.azure.com"
        resources: ["serviceexports", "multiclusterservices", "trafficmanagerprofiles", "trafficmanagerbackends"]
    omitStages:
      - "RequestReceived"
  # Capture CUD of user facing Karpenter resources
  - level: RequestResponse
    verbs: ["create", "update", "patch", "delete"]
    resources:
      - group: "karpenter.azure.com"
        resources: ["aksnodeclasses", "aksnodeclasses/status"]
      - group: "karpenter.sh"
        resources: ["nodepools", "nodepools/status", "nodeclaims", "nodeclaims/status"]
    omitStages:
      - "RequestReceived"
  # Get responses can be large; don't log response
  - level: Request
    verbs: ["get", "list", "watch"]
    resources:
      - group: ""
      - group: "admissionregistration.k8s.io"
      - group: "apiextensions.k8s.io"
      - group: "apiregistration.k8s.io"
      - group: "apps"
      - group: "authentication.k8s.io"
      - group: "authorization.k8s.io"
      - group: "autoscaling"
      - group: "batch"
      - group: "certificates.k8s.io"
      - group: "extensions"
      - group: "metrics.k8s.io"
      - group: "networking.k8s.io"
      - group: "policy"
      - group: "rbac.authorization.k8s.io"
      - group: "scheduling.k8s.io"
      - group: "settings.k8s.io"
      - group: "storage.k8s.io"
    omitStages:
      - "RequestReceived"
  # Default level for known APIs
  - level: RequestResponse
    resources:
      - group: ""
      - group: "admissionregistration.k8s.io"
      - group: "apiextensions.k8s.io"
      - group: "apiregistration.k8s.io"
      - group: "apps"
      - group: "authentication.k8s.io"
      - group: "authorization.k8s.io"
      - group: "autoscaling"
      - group: "batch"
      - group: "certificates.k8s.io"
      - group: "extensions"
      - group: "metrics.k8s.io"
      - group: "networking.k8s.io"
      - group: "policy"
      - group: "rbac.authorization.k8s.io"
      - group: "scheduling.k8s.io"
      - group: "settings.k8s.io"
      - group: "storage.k8s.io"
    omitStages:
      - "RequestReceived"
  # Default level for all other requests.
  - level: Metadata
    omitStages:
      - "RequestReceived"
Note
The audit policy is managed by AKS and can't be customized. The policy is designed to balance security observability with performance and cost optimization by reducing log volume for high-frequency, low-risk operations.
AKS data plane Container insights logs
Prerequisites and configuration requirements: Container insights requires a Log Analytics workspace for log storage and supports both managed identity and legacy authentication methods. For new clusters, managed identity authentication is recommended. Data collection can be customized using Azure Monitor Data Collection Rules (DCRs) to control costs and reduce ingestion volume.
Container insights collects various types of telemetry data from containers and AKS clusters to help you monitor, troubleshoot, and gain insights into your containerized applications running in your AKS clusters. For a list of tables and their detailed descriptions used by Container insights, see the Azure Monitor table reference. All the tables are available for log queries.
In AKS Automatic, Container insights is enabled by default as part of the monitoring baseline.
Use cost optimization settings to customize and control the metrics data collected through the Container insights agent. This feature supports the data collection settings for individual table selection, data collection intervals, and namespaces to exclude the data collection through Azure Monitor Data Collection Rules (DCRs). These settings control the volume of ingestion and reduce the monitoring costs of Container insights. You can customize Container insights collected data in the Azure portal using the following options. Selecting any options other than All (Default) makes the Container insights experience unavailable.
| Grouping | Tables | Notes |
|---|---|---|
| All (Default) | All standard Container insights tables | Required to enable the default Container insights visualizations. |
| Performance | Perf, InsightsMetrics | N/A |
| Logs and events | ContainerLog or ContainerLogV2, KubeEvents, KubePodInventory | Recommended if you enabled managed service for Prometheus metrics. |
| Workloads, Deployments, and HPAs | InsightsMetrics, KubePodInventory, KubeEvents, ContainerInventory, ContainerNodeInventory, KubeNodeInventory, KubeServices | N/A |
| Persistent Volumes | InsightsMetrics, KubePVInventory | N/A |
The Logs and events grouping captures the logs from the ContainerLog or ContainerLogV2, KubeEvents, and KubePodInventory tables, but not the metrics. The recommended path to collect metrics is to enable the managed service for Prometheus from your AKS cluster and use Azure Managed Grafana for data visualization. For more information, see Manage an Azure Monitor workspace.
ContainerLogV2 schema
Compatibility and configuration requirements: ContainerLogV2 schema is recommended for new Container insights deployments using managed identity authentication via Azure Resource Manager (ARM) templates, Bicep, Terraform, Azure Policy, or the Azure portal. The schema is compatible with Basic logs tier for cost savings and doesn't affect analytics or alerts functionality. For more information about how to enable ContainerLogV2 through either the cluster's DCR or configmap, see Enable the ContainerLogV2 schema.
Container insights in Azure Monitor provides a recommended schema for container logs, ContainerLogV2. The format includes the following fields for common queries to view data related to AKS and Azure Arc-enabled Kubernetes clusters:
- ContainerName
- PodName
- PodNamespace
Azure activity log
The activity log contains subscription-level events that track operations for each Azure resource as seen from outside that resource; for example, creating a new resource or starting a virtual machine.
Collection: Activity log events are automatically generated and collected in a separate store for viewing in the Azure portal.
Routing: You can send activity log data to Azure Monitor Logs so you can analyze it alongside other log data. Other locations such as Azure Storage, Azure Event Hubs, and certain Microsoft monitoring partners are also available. For more information on how to route the activity log, see Overview of the Azure activity log.
View AKS container logs, events, and pod metrics in real time
Prerequisites and setup requirements: Live data feature requires Container insights to be enabled on your cluster and uses direct Kubernetes API access. For private clusters, access requires a computer in the same private network as the cluster. Authentication follows the Kubernetes RBAC model and requires appropriate cluster permissions.
You can view AKS container logs, events, and pod metrics using the live data feature in Container insights and troubleshoot issues in real time with direct access to kubectl logs -c, kubectl get events, and kubectl top pods.
Note
AKS uses Kubernetes cluster-level logging architectures. The container logs are located at /var/log/containers on the node. To access a node, see Connect to AKS cluster nodes.
To learn how to set up this feature, see Configure live data in Container insights. The feature directly accesses the Kubernetes API. For more information about the authentication model, see the Kubernetes API.
View AKS resource live logs
Private cluster network requirements: To access logs from a private cluster, you must use a computer that's in the same private network as the cluster.
In the Azure portal, go to your AKS cluster.
Under Kubernetes resources, select Workloads.
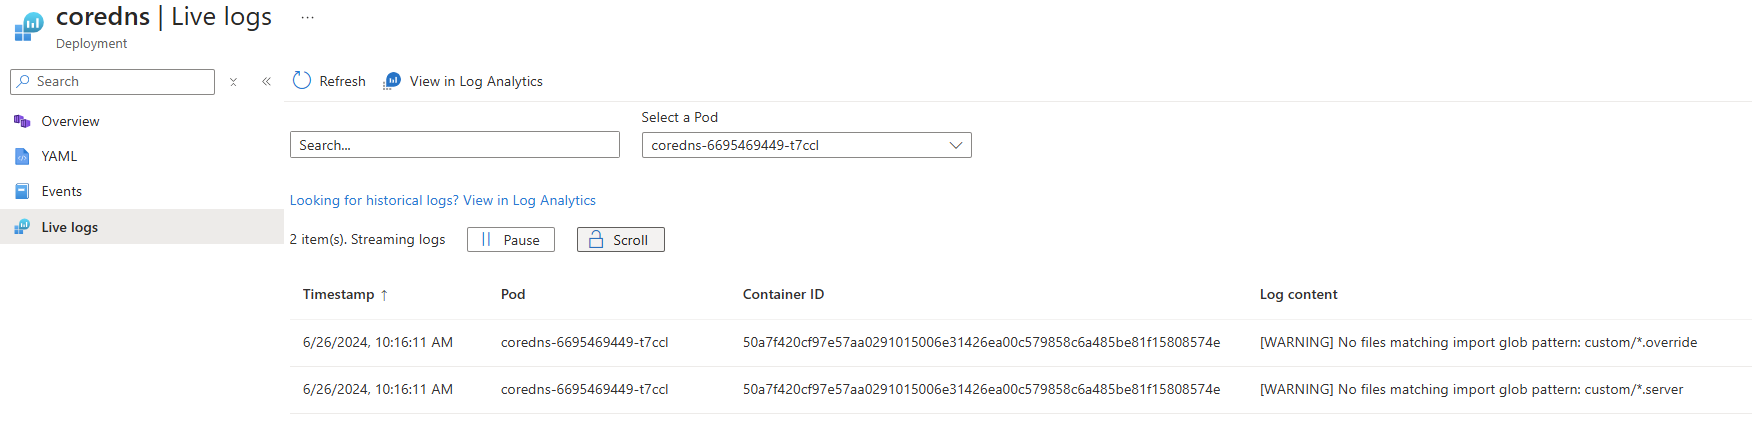
For Deployment, Pod, Replica Set, Stateful Set, Job, or Cron Job, select a value, and then select Live Logs.
Select a resource log to view.
The following example shows the logs for a pod resource:

View container live logs using Container insights
Authentication and data streaming: After successful authentication, if data can be retrieved, it begins streaming to the Live Logs tab. Log data appears in a continuous stream. Alternative log access is available through View Logs in Log Analytics for historical analysis.
You can view real-time log data as the container engine generates it on the Cluster, Nodes, Controllers, or Containers tab.
In the Azure portal, go to your AKS cluster.
Under Monitoring, select Insights.
On the Cluster, Nodes, Controllers, or Containers tab, select a value.
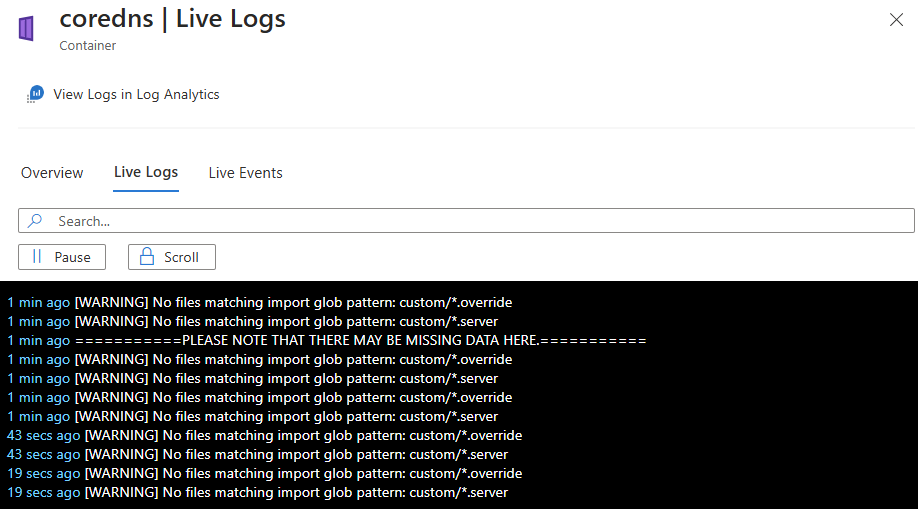
On the Overview pane for the resource, select Live Logs.
The following image shows the logs for a container resource:

View container live events using Container insights
Event streaming and access: Real-time event data streams as the container engine generates it. Events include pod creation, deletion, scaling operations, and error conditions. Historical event data is accessible via View Events in Log Analytics.
You can view real-time event data as the container engine generates it on the Cluster, Nodes, Controllers, or Containers tab.
In the Azure portal, go to your AKS cluster.
Under Monitoring, select Insights.
Select the Cluster, Nodes, Controllers, or Containers tab, and then select an object.
On the resource Overview pane, select Live Events.
After successful authentication, if data can be retrieved, it begins streaming to the Live Events tab. The following image shows the events for a container resource:


View pod live metrics using Container insights
Metrics scope and availability: Live metrics are available for pod resources on the Nodes or Controllers tabs. Metrics include CPU usage, memory consumption, network I/O, and filesystem statistics. Historical metrics are accessible through View Events in Log Analytics.
You can view real-time metrics data as the container engine generates it on the Nodes or Controllers tab by selecting a pod resource.
In the Azure portal, go to your AKS cluster.
Under Monitoring, select Insights.
Select the Nodes or Controllers tab, and then select a pod object.
On the resource Overview pane, select Live Metrics.
After successful authentication, if data can be retrieved, it begins streaming to the Live Metrics tab. The following image shows the metrics for a pod resource:

Analyze monitoring data
There are many tools for analyzing monitoring data.
Azure Monitor tools
Azure Monitor supports the following basic tools:
Metrics explorer, a tool in the Azure portal that allows you to view and analyze metrics for Azure resources. For more information, see Analyze metrics with Azure Monitor metrics explorer.
Log Analytics, a tool in the Azure portal that allows you to query and analyze log data by using the Kusto query language (KQL). For more information, see Get started with log queries in Azure Monitor.
The activity log, which has a user interface in the Azure portal for viewing and basic searches. To do more in-depth analysis, you have to route the data to Azure Monitor logs and run more complex queries in Log Analytics.
Tools that allow more complex visualization include:
- Dashboards that let you combine different kinds of data into a single pane in the Azure portal.
- Workbooks, customizable reports that you can create in the Azure portal. Workbooks can include text, metrics, and log queries.
- Grafana, an open platform tool that excels in operational dashboards. You can use Grafana to create dashboards that include data from multiple sources other than Azure Monitor.
- Power BI, a business analytics service that provides interactive visualizations across various data sources. You can configure Power BI to automatically import log data from Azure Monitor to take advantage of these visualizations.
Azure Monitor export tools
You can get data out of Azure Monitor into other tools by using the following methods:
Metrics: Use the REST API for metrics to extract metric data from the Azure Monitor metrics database. The API supports filter expressions to refine the data retrieved. For more information, see Azure Monitor REST API reference.
Logs: Use the REST API or the associated client libraries.
Another option is the workspace data export.
To get started with the REST API for Azure Monitor, see Azure monitoring REST API walkthrough.

Monitor AKS clusters in the Azure portal
The Monitoring tab on the Overview pane for your AKS cluster resource offers a quick way to start viewing monitoring data in the Azure portal. This tab includes graphs with common metrics for the cluster separated by node pool. You can select any of these graphs to further analyze the data in the metrics explorer.
The Monitoring tab also includes links to the Azure managed service for Prometheus and Container insights for the cluster. You can enable these tools on the Monitoring tab. You might also see a banner at the top of the pane that recommends other features to improve monitoring for your cluster.
In AKS Automatic, Azure Monitor dashboards with Grafana are available by default in the Azure portal experience.
Tip
To access monitoring features for all AKS clusters in your subscription, on the Azure portal home page, select Azure Monitor.
Observe and troubleshoot applications using AKS desktop
AKS desktop is an application-focused desktop experience for Azure Kubernetes Service (AKS) that helps you connect to clusters, view resources, deploy applications, and troubleshoot workloads without deep Kubernetes expertise.
AKS desktop complements Azure Monitor and Container insights by giving application teams a single, ready-to-use place for high level day-to-day observation and troubleshooting of their induvidual application workloads, without building custom tooling or switching between tools.
From an AKS desktop Project, you can:
- View metrics such as CPU and memory consumption for application components.
- Stream pod logs in real time for debugging.
- Visualize dependencies between workloads and services using the resource map.

For more information, see AKS desktop overview.
Kusto queries
You can analyze monitoring data in the Azure Monitor Logs / Log Analytics store by using the Kusto query language (KQL).
Important
When you select Logs from the service's menu in the portal, Log Analytics opens with the query scope set to the current service. This scope means that log queries will only include data from that type of resource. If you want to run a query that includes data from other Azure services, select Logs from the Azure Monitor menu. See Log query scope and time range in Azure Monitor Log Analytics for details.
For a list of common queries for any service, see the Log Analytics queries interface.
Alerts
Azure Monitor alerts proactively notify you when specific conditions are found in your monitoring data. Alerts allow you to identify and address issues in your system before your customers notice them. For more information, see Azure Monitor alerts.
There are many sources of common alerts for Azure resources. For examples of common alerts for Azure resources, see Sample log alert queries. The Azure Monitor Baseline Alerts (AMBA) site provides a semi-automated method of implementing important platform metric alerts, dashboards, and guidelines. The site applies to a continually expanding subset of Azure services, including all services that are part of the Azure Landing Zone (ALZ).
The common alert schema standardizes the consumption of Azure Monitor alert notifications. For more information, see Common alert schema.
Types of alerts
You can alert on any metric or log data source in the Azure Monitor data platform. There are many different types of alerts depending on the services you're monitoring and the monitoring data you're collecting. Different types of alerts have various benefits and drawbacks. For more information, see Choose the right monitoring alert type.
The following list describes the types of Azure Monitor alerts you can create:
- Metric alerts evaluate resource metrics at regular intervals. Metrics can be platform metrics, custom metrics, logs from Azure Monitor converted to metrics, or Application Insights metrics. Metric alerts can also apply multiple conditions and dynamic thresholds.
- Log alerts allow users to use a Log Analytics query to evaluate resource logs at a predefined frequency.
- Activity log alerts trigger when a new activity log event occurs that matches defined conditions. Resource Health alerts and Service Health alerts are activity log alerts that report on your service and resource health.
Some Azure services also support smart detection alerts, Prometheus alerts, or recommended alert rules.
For some services, you can monitor at scale by applying the same metric alert rule to multiple resources of the same type that exist in the same Azure region. Individual notifications are sent for each monitored resource. For supported Azure services and clouds, see Monitor multiple resources with one alert rule.
Recommended alert rules
For some Azure services, you can enable recommended out-of-the-box alert rules.
The system compiles a list of recommended alert rules based on:
- The resource provider's knowledge of important signals and thresholds for monitoring the resource.
- Data that tells what customers commonly alert on for this resource.
Note
Recommended alert rules are available for:
- Virtual machines
- Azure Kubernetes Service (AKS) resources
- Log Analytics workspaces
Configure Prometheus metrics-based alerts
Download and configuration requirements: Alert rules are available as downloadable ARM templates or Bicep files. Before configuring alerts, ensure the managed service for Prometheus is enabled on your cluster and an Azure Monitor workspace is properly linked to your AKS cluster.
When you enable collection of the managed service for Prometheus metrics for your cluster, you can download a collection of recommended managed service for Prometheus alert rules.
The download includes the following rules:
| Level | Alerts |
|---|---|
| Cluster level | KubeCPUQuotaOvercommitKubeMemoryQuotaOvercommitKubeContainerOOMKilledCountKubeClientErrorsKubePersistentVolumeFillingUpKubePersistentVolumeInodesFillingUpKubePersistentVolumeErrorsKubeContainerWaitingKubeDaemonSetNotScheduledKubeDaemonSetMisScheduledKubeQuotaAlmostFull |
| Node level | KubeNodeUnreachableKubeNodeReadinessFlapping |
| Pod level | KubePVUsageHighKubeDeploymentReplicasMismatchKubeStatefulSetReplicasMismatchKubeHpaReplicasMismatchKubeHpaMaxedOutKubePodCrashLoopingKubeJobStaleKubePodContainerRestartKubePodReadyStateLowKubePodFailedStateKubePodNotReadyByControllerKubeStatefulSetGenerationMismatchKubeJobFailedKubeContainerAverageCPUHighKubeContainerAverageMemoryHighKubeletPodStartUpLatencyHigh |
For more information, see Create log alerts from Container insights and Query logs from Container insights.
Log alerts can measure two types of information to help you monitor diverse scenarios:
- Result count: Counts the number of rows returned by the query. Use this information to work with events like Windows event logs, syslog events, and application exceptions.
- Calculation of a value: Makes a calculation based on a numeric column. Use this information to include diverse resources. An example is CPU percentage.
Most log queries compare a DateTime value to the present time using the now operator and going back one hour. To learn how to build log-based alerts, see Create log alerts from Container insights.
AKS alert rules
The following table lists some suggested alert rules for AKS. These alerts are only examples. You can set alerts for any metric, log entry, or activity log entry listed in the AKS monitoring data reference.
| Condition | Description |
|---|---|
| CPU Usage Percentage > 95 | Alerts when the average CPU usage across all nodes exceeds the threshold. |
| Memory Working Set Percentage > 100 | Alerts when the average working set across all nodes exceeds the threshold. |
Advisor recommendations
For some services, if critical conditions or imminent changes occur during resource operations, an alert displays on the service Overview page in the portal. You can find more information and recommended fixes for the alert in Advisor recommendations under Monitoring in the left menu. During normal operations, no advisor recommendations display.
For more information on Azure Advisor, see Azure Advisor overview.
Note
If you're creating or running an application that runs on your service, Azure Monitor application insights might offer more types of alerts.
AKS node network metrics monitoring
Version and enablement requirements: In Kubernetes version 1.29 and later, node network metrics are enabled by default for all clusters that have Azure Monitor enabled. For earlier Kubernetes versions, you must manually enable network monitoring through cluster configuration. This feature requires Azure Monitor or Container insights to be configured on your cluster.
Node network metrics are crucial for maintaining a healthy and performant Kubernetes cluster. By collecting and analyzing data about network traffic, you can gain valuable insights about your cluster's operation and identify potential issues before they lead to outages or performance loss.
The following node network metrics are enabled by default and are aggregated per node. All metrics include the labels cluster and instance (node name). You can easily view these metrics using the Managed Grafana dashboard under Azure Managed Prometheus > Kubernetes > Networking > Clusters.
AKS node network metrics by data plane type
All metrics include these labels:
clusterinstance(node name)
OS support and limitations: For Cilium data plane scenarios, the Container Network Observability feature provides metrics only for Linux node pools. Currently, Windows isn't supported for Container Network Observability metrics. Ensure your cluster has Linux node pools for full Cilium metrics availability.
For Cilium data plane scenarios, the Container Network Observability feature provides metrics only for Linux. Currently, Windows isn't supported for Container Network Observability metrics.
Cilium exposes several metrics that Container Network Observability uses:
| Metric name | Description | Extra labels | Linux | Windows |
|---|---|---|---|---|
cilium_forward_count_total |
Total forwarded packet count | direction |
Supported ✅ | Unsupported ❌ |
cilium_forward_bytes_total |
Total forwarded byte count | direction |
Supported ✅ | Unsupported ❌ |
cilium_drop_count_total |
Total dropped packet count | direction, reason |
Supported ✅ | Unsupported ❌ |
cilium_drop_bytes_total |
Total dropped byte count | direction, reason |
Supported ✅ | Unsupported ❌ |
Disable AKS node network metrics collection
You can disable network metrics collection on specific nodes by adding the label networking.azure.com/node-network-metrics=disabled to those nodes.
Note
Retina has an operator: "Exists" effect: NoSchedule toleration, so it bypasses NoSchedule taints. Therefore, labels are used instead of taints to control scheduling.
If the cluster is autoprovisioning/autoscaling nodes, you need to manually enable the flag on each node.
Important
This feature isn't applicable if Advanced Container Networking Services (ACNS) is enabled on your cluster.
To disable metrics collection on a node:
kubectl label node <node-name> networking.azure.com/node-network-metrics=disabled
For detailed pod-level and DNS metrics, see Advanced Container Networking Services.
Related content
- What is AKS Automatic?
- Create an AKS Automatic cluster
- For a reference of the metrics, logs, and other important values created for AKS, see the AKS monitoring data reference.
- For general details on monitoring Azure resources, see Monitor Azure resources using Azure Monitor.
- For detailed monitoring of the complete Kubernetes stack, see Monitor Kubernetes clusters using Azure services and cloud native tools.
- For collecting metrics data from Kubernetes clusters, see Managed service for Prometheus in Azure Monitor.
- For collecting logs in Kubernetes clusters, see Azure Monitor features for Kubernetes monitoring.
- For data visualization, see Azure Workbooks and Monitor your Azure services in Grafana.