Note
Access to this page requires authorization. You can try signing in or changing directories.
Access to this page requires authorization. You can try changing directories.
The Growth, inclusion and engagement report uses a template populated by Viva Insights data to help organizations support, engage, and retain employees throughout the employee lifecycle.
The report enables you to:
- Learn about people's experiences through the employee lifecycle
- Gain insight into the composition of senior leadership
- Identify if networks are set up to promote career advancement
- Uncover potential drivers of engagement
You can select any type of attribute you want to analyze different employee groups. Each report page includes recommended actions and metric definitions.
To populate the report in Power BI, you'll need to set up and successfully run the predefined Growth, inclusion and engagement query in Viva Insights.
Demonstration
The following demonstration uses sample data that’s only representative of this report and might not be exactly what you see in a live report specific to your organization's unique data.
Prerequisites
Before you can run the queries and populate the report in Power BI, you’ll need to:
Be assigned the role of Insights Analyst in Viva Insights.
Have the December 2022 (or newer) version of Power BI Desktop installed. If you have an earlier version of Power BI installed, uninstall it before installing the new version. Then go to Get Power BI Desktop to download and install the latest version.
- Confirm that your organizational data includes Organization and HireDate.
- Confirm that your organizational data includes LevelDesignation. This attribute is required to load the “Promote career advancement” page. If this attribute is missing, you can still run the query, but this page will be empty.
Report setup
Run query
In the Viva Insights analyst experience, select Analysis.
Under Power BI templates, navigate to Growth, inclusion and engagement and select Set up analysis. To get more information about the Growth, inclusion and engagement template before running your analysis, select Learn more.
Under Query setup:
- Type a Query name.
- Select a Time period. Time period defaults to Last 6 months.
- Set Auto-refresh (optional). You can set the query to automatically update by checking the Auto-refresh box. When you select the Auto-refresh option, your query automatically runs and computes a new result every time Viva Insights gets updated collaboration data for licensed people.
Note
If organizational data used in an auto-refreshing query changes (for example, an attribute name is altered or an attribute is removed), the query might stop auto-refreshing.
- Type a Description (optional).
- Change the metric rule (optional). To set a new metric rule, select More settings. Then, pick a new rule from the list. For more information about metric rules, refer to Metric rules.
Note
The More settings pane also contains Group by settings. Power BI queries are set to Group by Week, and you're not able to edit this field.
Under Predefined template metrics, view the list of preselected metrics, which appear as gray tags. These metrics are required to set up the Power BI report and you can’t remove them. You can add other metrics by selecting Add metrics.
Important
Low-quality or missing organizational data might affect your metrics and result in warnings or errors. Learn more about data-quality notifications in Data quality in the analyst experience.
In Select which employees you want to include in the query, add filters to narrow down the employees in scope for your report. Don’t remove the predefined “Is Active” filter. For more details about filter and metric options, refer to Filters. If you notice a warning or error here, it's because one of your attributes is missing from your organizational data or is of low quality.
Under Select which employee attributes you want to include in the query, add up to 14 organizational attributes, including the required Organization and HireDate attributes, and the optional LevelDesignation attributes. Once the query runs, you can use these attributes to group and filter the reports.
Important
This PowerBI query needs some specific attributes to run, and we've preselected them for you. These attributes appear in gray and you can't remove them. We might also include some attributes that help your template, but aren't required for your query to run. These attributes appear in blue and you can remove them.
If you notice attributes marked with yellow warnings, that attribute's quality is low. If you notice attributes marked in red and the query's Run button disabled, then your organizational data is missing that attribute.
Learn more about attributes and data quality in Data quality in the analyst experience.
Under Select which spotlight attributes you want to include in the query, add at least one and up to five attributes to use as a legend for insights in the report. You’ll also be able to focus on a specific group of employees in the report. Insights for this group will be highlighted.
Under Select an attribute that indicates the employee’s engagement score, you can optionally select an attribute that represents how engaged employees are.
Select Run on the upper right side of the screen. The query might take a few minutes to run.
When your query results are ready, go to the Query results page and select the Power BI icon. Download the Power BI template and get the partition and query identifiers. You’ll need these identifiers later.
Link report to query
- Open the downloaded template.
- If you're prompted to select a program, select Power BI.
- When you're prompted by Power BI:
- Paste in the partition and query identifiers.
- Set the Minimum group size for data aggregation within this report's visualizations in accordance with your company's policy for viewing Viva Insights data.
- Select Load to import the query results into Power BI.
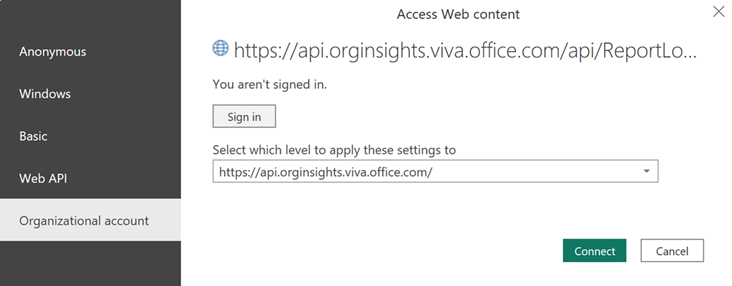
- If prompted by Power BI, sign in using your organizational account. Power BI then loads and prepares the data. For large files, this process might take a few minutes.
Important
You need to sign in to Power BI with the same account you use to access Viva Insights. If available, select Organizational account from the left. You might have to sign in more than once.
Report settings
After the Growth, inclusion and engagement report is set up and populated with Viva Insights data in Power BI, use the settings listed below.
| Setting | Function |
|---|---|
| Spotlight attribute | Sets the employee attribute to concentrate on. The spotlight attribute will be used as the legend for insights in the report. The spotlight attributes you can choose depend on the attributes you selected when setting up the query in the analyst workbench. You can change this setting at any time. |
| Focus key insights on | Sets the group of employees you want to focus on. For example, if you selected "Generation" as the default spotlight attribute, you can select "Millennials" to see specific insights about employees tagged as Millennials in the organization. |
| Favorable engagement score(s) | Identifies a particular engagement score value as favorable. If you included an attribute that represents employee engagement results, you can select one or more values that represent “favorably engaged” employees. This affects how results are displayed on the Boost engagement page. |

About the report
The Growth, inclusion and engagement report includes several report pages, outlined below, to help you explore how the experience of various categories of employees differs, and identify actions you might take in response.
Except for the first two pages, each report page follows a similar format: an overall result for the employee group in focus, and then a breakdown of that result by the organizational attribute selected. You can also see how the result has trended over time, or select Show suggestions, where you can access additional details about suggested actions.
On some pages, you can select View multiple attributes under a breakdown of the metric by organizational attribute. This allows you to select two attributes and view the results across the attributes.

Overview
Get a high-level overview of the five opportunities with a highlighted insight for each.
Attract talent
Discover which attributes the new talent pool brings compared to the more tenured workforce. If your goal, for example, is to bolster the representation of a particular group of employees, you can compare the composition of new hires to tenured employees.
Onboard new hires
Learn how quickly groups of new hires are integrating into the company and whether they are getting the manager support they need. Helping new hires engage with their managers and develop their internal network in the first months in a new position can set them up for long-term success.
Develop and grow
Understand whether new hires receive sufficient time in one-on-ones with their direct manager and visibility to leadership. Employees who have regular one-on-ones with their managers are three times more likely to be engaged as employees who don’t, and manager coaching helps support career development and skill growth.
Promote career advancement
Explore the composition of senior leadership and access to new connections across the organization. Examining access to large and diverse internal network connections can indicate whether employee networks can help advance their careers through new opportunities.
Boost engagement
Analyze the work patterns that support engagement for different groups of employees. Organizations with employees who report high levels of engagement also see greater retention.
Glossary
View the metrics and other key terms used in the report.
Power BI tips, FAQs, and troubleshooting
For details about how to share the report and other Power BI tips, troubleshoot any issues, or review the FAQ, see Power BI tips, FAQ, and troubleshooting.