Create a report in a model-driven form
Model-driven apps provide several reporting options to give users the ability to analyze their business data. As the volume of data increases, you have reporting capability options that scale.
The reporting infrastructure in a model-driven app is shared with and separate from the database. In this architecture, each report runs against the customers' individual database instance. Users can run a report multiple times without restrictions.
Create a report by using the report wizard
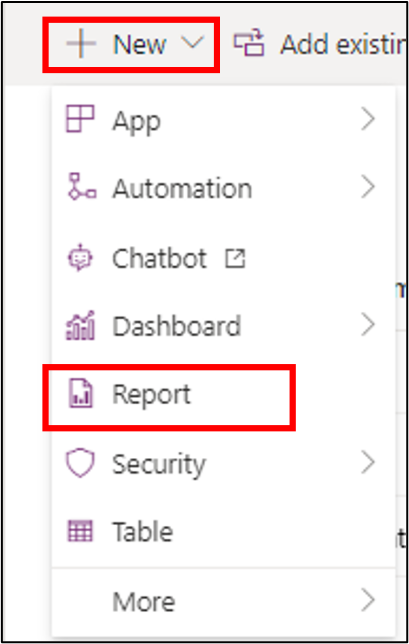
To create a report by using a wizard, you need to open a solution from the maker portal. Select Report under New in the action pane.
A New Report screen appears in the classic development interface with a Report Wizard button. The wizard provides you with three options:
Start a new report
Start from an existing report without overwriting the existing
Start from an existing report overwriting the existing
If you want to create a new report by copying from an existing report, you need to select the second option. If you want to overwrite an existing report, you need to select the third option.
If you start a new report, select the first option and select Next. After defining the report name and description, you'll need to specify the primary table name for the report in the Primary record type menu. If the report shows data from child tables also, you can select the child table from the Related record type menu. In this menu, you can view the lists of tables that have a many-to-one relationship with the primary table. Select Next.
The wizard's next screen provides options for you to select the data filter criteria of the report.

You can create views in the table, which you can assign in the Use Saved View list. This will filter data based on the filter conditions that you select. You can also set the sort order for data in the report. You can also select the columns that will be displayed in the report.
Alternatively, you can select [new] in the Use Saved View list and customize the report in this screen. After you've Select, you can select the table columns to be displayed in the report. You can also select comparison operators to filter data based on given criteria. The following operators are available:
Equals
Does not equal
Contains
Does not contain
Begins with
Does not begin with
End with
Does not end with
Contains data
Does not contain data
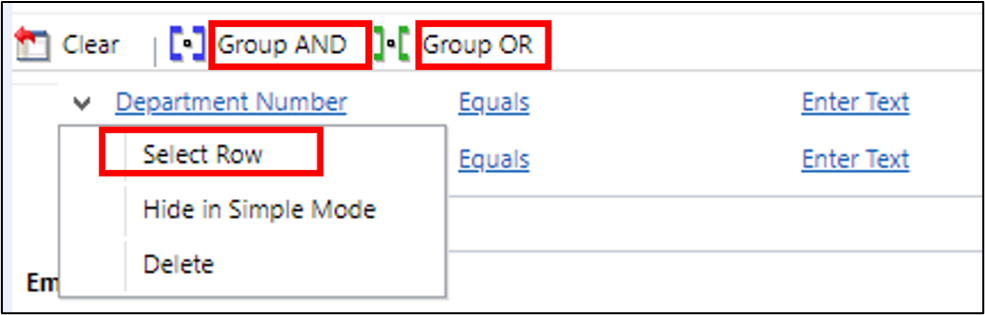
You can select multiple columns together by selecting the Select Row option and then group the conditions together by using the Group AND or Group OR buttons.
By choosing the Select link, you can also include a table that is related to the primary table of the report. Any table that has a relationship with the primary table will be available to select. You can select columns from the related table and apply filter conditions on the related table columns.
Additionally, you can apply these conditions and filters on the Related table, that you already selected.
The next screen in the wizard helps to design the layout of the report.

To define the sort order of the report, select Configure Sorting. You can select Add a column to select the columns to be displayed in sequence. You can also select Add a grouping to display the report grouping data based on criteria.
When you select Select here to add a column a dialog box appears. Here, you can define column width. You can also define the Summary type to aggregate any numeric fields, as shown in the following screenshot.

The next screen in the wizard helps you design the format of the report. On this screen, you can select if the report will be tabular or graphical.

If you'd like a graphical report, make sure that you include numeric columns. If you've only added non-numeric columns to your report, the only option to select here will be Table only.
The four supported graphical reports are:
Vertical bar chart
Horizontal bar chart
Line chart
Pie chart
You can also define which table forms and views that you can launch the report from in a model-driven app.

To run the report, you can open the form that's selected under Categorization. Under Run Report, you are able to view the report that you've developed.
Performance tips for reports
Consider the following performance tips for reports:
When you create custom reports or dashboards, design them to query smaller datasets over shorter periods of time by adding a time-based filter in the report, such as the current month or quarter.
Limit the number of tables that are needed to return the result. This approach helps reduce the time that's required to run the query and return the result set.
Reduce the rows in detailed reports. You can use filtering to reduce the number of rows that are returned by the query to reduce timeouts.
For aggregated or summarized reports, make sure that you use queries to push the aggregation to the database and not fetch detailed rows and perform aggregation in the SQL Server Reporting Services report.
When appropriate for your business, users should run the default (out-of-the-box) reports and dashboards. These reports and dashboards are typically designed to query for each user dataset, so in most cases won't exceed the dataset limit.