Create measures
In Power BI, measures are defined calculations on your data that are performed at the time of your query. Measures are calculated as you interact with your reports and aren't stored in your database.
Tasks in this unit include:
Create a measure
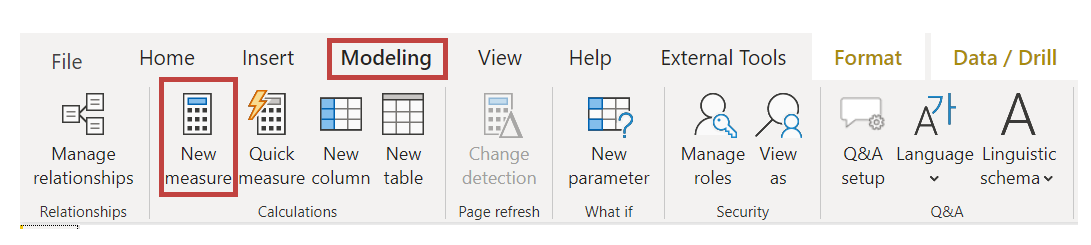
To create a measure, in Report view, select New Measure from the Modeling tab.
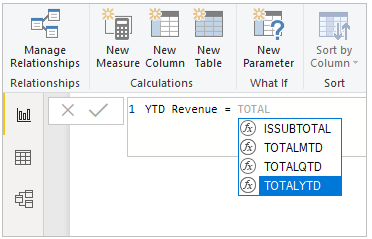
From the Formula bar, you can enter the DAX expression that defines your measure. As you enter your calculation, Power BI suggests relevant DAX functions and data fields. You also receive a tooltip that explains some of the syntax and function parameters.
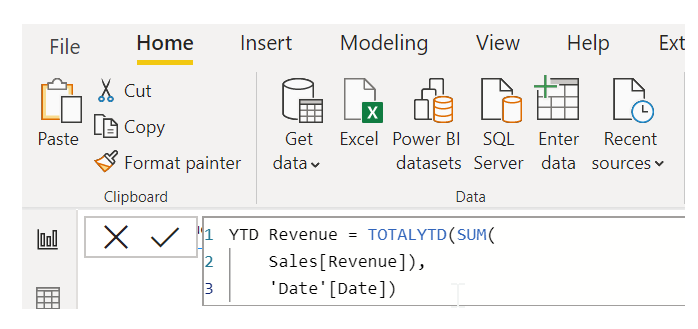
To check the new measure works, make sure you set the Date field in the Date table to type Date. If your calculation is long, you can add extra line breaks in the Expression Editor by typing ALT-Enter.
Apply a measure
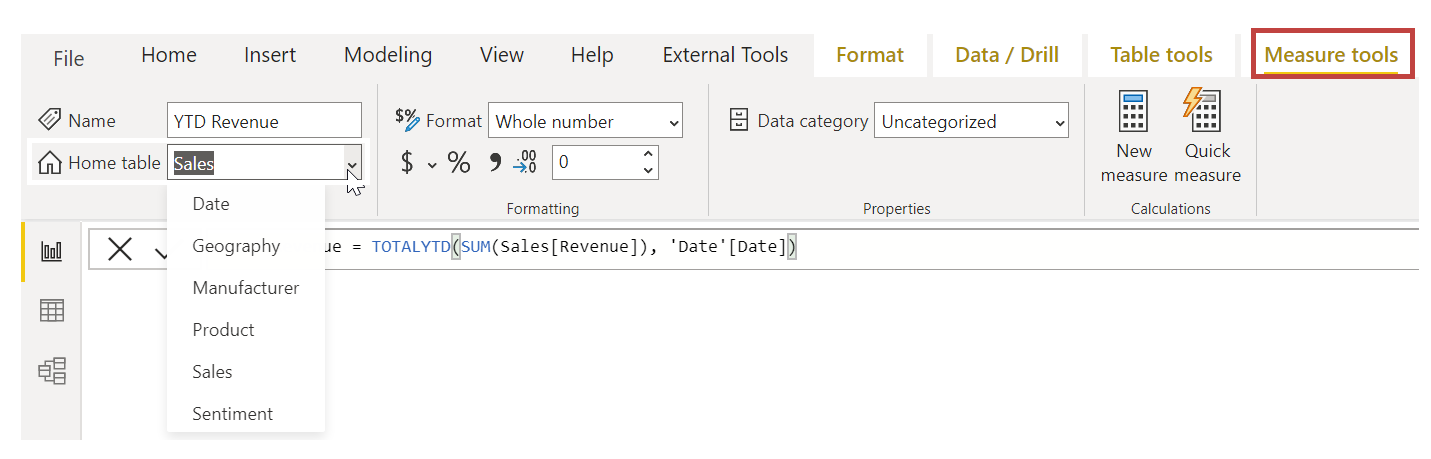
After you create a new measure, it will appear in one of the tables on the Data pane, which is found on the right side of the screen. Power BI inserts the new measure into whichever table you currently selected. While it doesn't matter, exactly, where the measure is located in your data, you can easily move it by selecting the measure and using the Home Table drop-down menu on the Measure tools tab.
You can use a measure like any other table column: just drag and drop it onto the report canvas or visualization fields. Measures also integrate seamlessly with slicers, segmenting your data on the fly, which means that you can define a measure once and then use it in many different visualizations.
For more information, see Tutorial: Create your own measures in Power BI Desktop.