Note
Access to this page requires authorization. You can try signing in or changing directories.
Access to this page requires authorization. You can try changing directories.
Data point annotation is a PowerPoint Power BI add-in feature that enables you to attach text callouts to data points in supported chart visuals that you've added to your PowerPoint presentation as single visual views (not as parts of a page view). These annotations make it possible for you to call attention to and comment on specific points you want to emphasize in your storytelling.
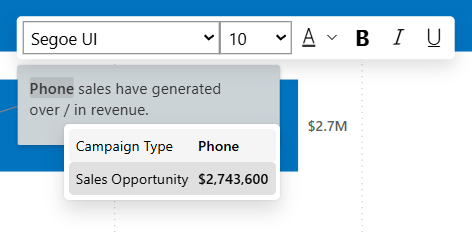
In your annotations, you can reference the data point's measure and category values. These references point to the actual data point, ensuring that the data shown in your annotation will update automatically when the actual data changes.

When and where do annotations show up?
Annotations you add to a visual are saved in the context of the specific add-in instance where you embedded your visual, and are available only there. This means:
Whenever you or others view the slide that contains the visual in this add-in instance, the annotations are loaded as well.
The annotations won't show up when you view the same visual in the Power BI service or any other place, including other add-in instances.
The fact that annotations are saved and stored with the add-in instance that the visual is embedded in means that you can have different sets of annotations for the same visual when it appears in other add-in instances. This makes it possible to tailor your annotations to the context they appear in.
Annotations are displayed whenever the data points they're attached to are visible. If a data point disappears as the result of filtering, any annotations it has also disappear. Likewise, if the data updates and a data point no longer appears in the visual, any annotations the data point had won't appear either.
Annotations are included in snapshots, if they are visible at the time the snapshot is taken.
Create an annotation
To create an annotation, you first need to embed a single visual view into the add-in in a slide, or choose a single visual view that you’ve already embedded in the presentation. Annotations aren't available on visuals that are part of an embedded page view.
When you have your desired single visual view:
In edit mode, select the data point on the visual, open the context menu, and choose Annotate.
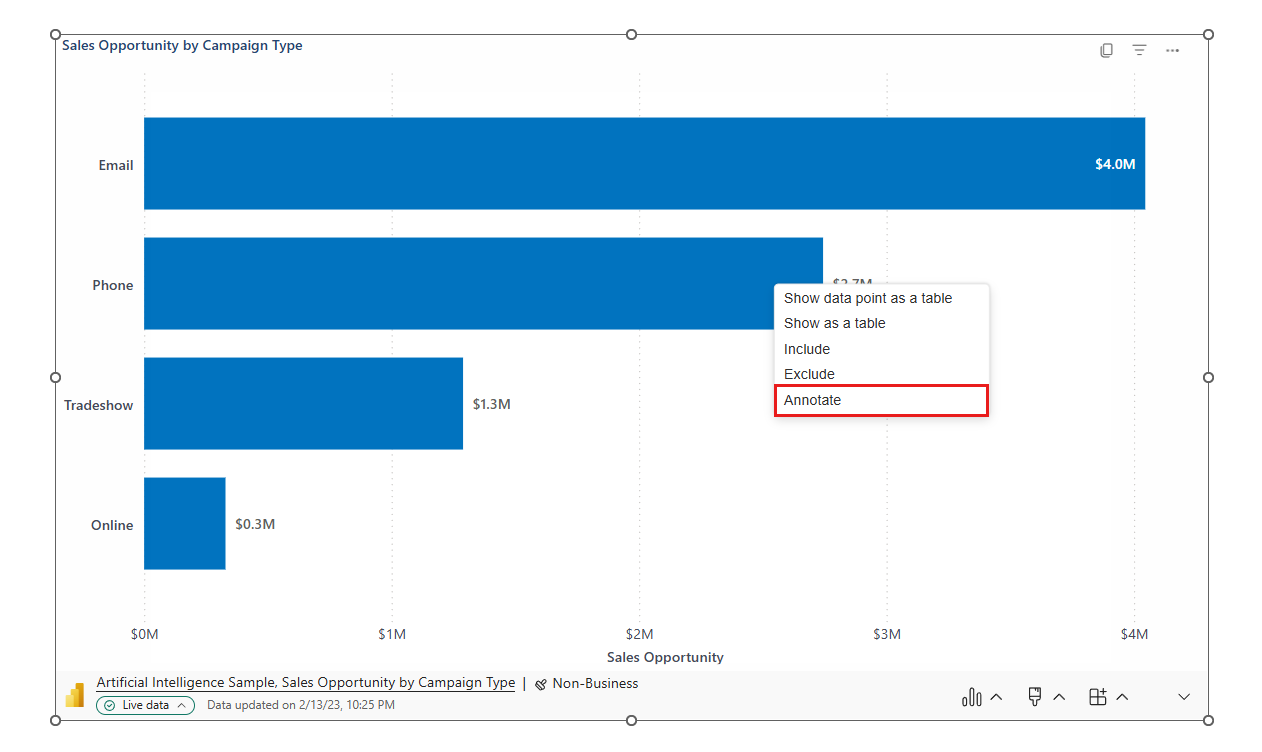
Type your text into the text box. To insert a reference to the data point's measure or category value, type "/" and then choose the desired option from the menu that appears. Format the text as desired using the formatting toolbar.
Select outside the text box to complete the annotation. After you've completed the annotation, you can select and drag the box around to reposition it.

Note
You can only format the text of the annotation. Other properties, such as box size and color, are determined by the add-in and the report's theme, and aren't under the user's control.
Manage annotation visibility
You can choose to show or hide the annotations in a visual, depending on your needs. It doesn't matter whether you're in edit mode or presentation mode - you can manage annotation visibility from either mode.
To toggle between showing and hiding a visual's annotations, open the Data options menu and choose Annotations. When there are hidden annotations, a green dot appears on the Data options icon to remind you that hidden annotations exist and can be displayed, if desired.

You can also toggle between showing and hiding annotations using keyboard shortcuts. The shortcuts are particularly useful in presentation mode, as they allow you to hide or display annotations without having to interrupt your presentation by opening a menu or expanding the footer.
Supported chart visuals
- All native Power BI Cartesian charts except Waterfall, Funnel, and Scatter charts.
- Donut and Pie charts.
Keyboard shortcuts
| Keyboard shortcut | Action |
|---|---|
| Ctrl + Alt + I | Hide/show annotations. |
| Alt + H | Move focus to annotation toolbar. |
| Alt + Shift + I | Move focus to annotations group panels. |
Considerations and limitations
- Annotations aren't supported in custom visuals.
- Annotations are supported in Pie and Donut charts, and in all native Power BI Cartesian charts except Waterfall, Funnel, and Scatter charts.
- Annotations are available only when embedding a single visual view, and not a page view.
- Users can't control the size and style of the annotation box. These properties are automatically determined by the report theme. Users can only control text formatting.