Note
Access to this page requires authorization. You can try signing in or changing directories.
Access to this page requires authorization. You can try changing directories.
To make sure your dataflows run as expected, monitor your dataflow refreshes. Refresh history and the monitoring hub provide details about what happens during a refresh. This article explains the available monitoring features and how to use them.
Refresh history
Refresh history is available using the drop-down menu in your workspace. You can access it by selecting the Recent runs button.

When you open your dataflow refresh history, you first notice a list of all your data refreshes. This first screen provides you with information about:
- Start time
- Status
- Duration
- Type

The refresh history page shows up to 50 refreshes or up to six months of history, whichever comes first. OneLake stores up to 250 refreshes or six months of history. From this page, you can start a new refresh, schedule a refresh, or edit the dataflow.
Download a CSV file of the refresh
Sometimes you need a CSV file for one or more refreshes. To download the file:
Open the recent runs of the dataflow.
Select the run(s) you want to get a CSV file from.
Download the CSV.


Download detailed logs of the refresh
Detailed logs contain diagnostic information from the Power Query Mashup engine. Use them to troubleshoot a refresh or to provide more context when you contact Microsoft support. To download the logs:
Open the recent runs of the dataflow.
Select the run you want to get detailed logs from.
On the bottom left of the details screen, select the Download detailed logs button.


The ZIP archive contains multiple Mashup engine log files for the selected refresh. The logs become available a few minutes after the refresh completes and remain available for up to 28 days. You need at least the Viewer role in the workspace to download them.
To learn how the archive is organized and how to interpret its JSON Lines records, see Understand Dataflow Gen2 detailed refresh logs.
To download the detailed logs for dataflows that are refreshed using a gateway, you need to enable the Admin consent for gateway diagnostics feature on the gateway level.
Reviewing your dataflow refresh from the UI
Once you determined which dataflow you want to investigate, you can drill down into one of the refreshes by selecting the Start time field. This screen provides you with more information about the refresh that was performed. This includes general information about the refresh and a list of tables and activities.
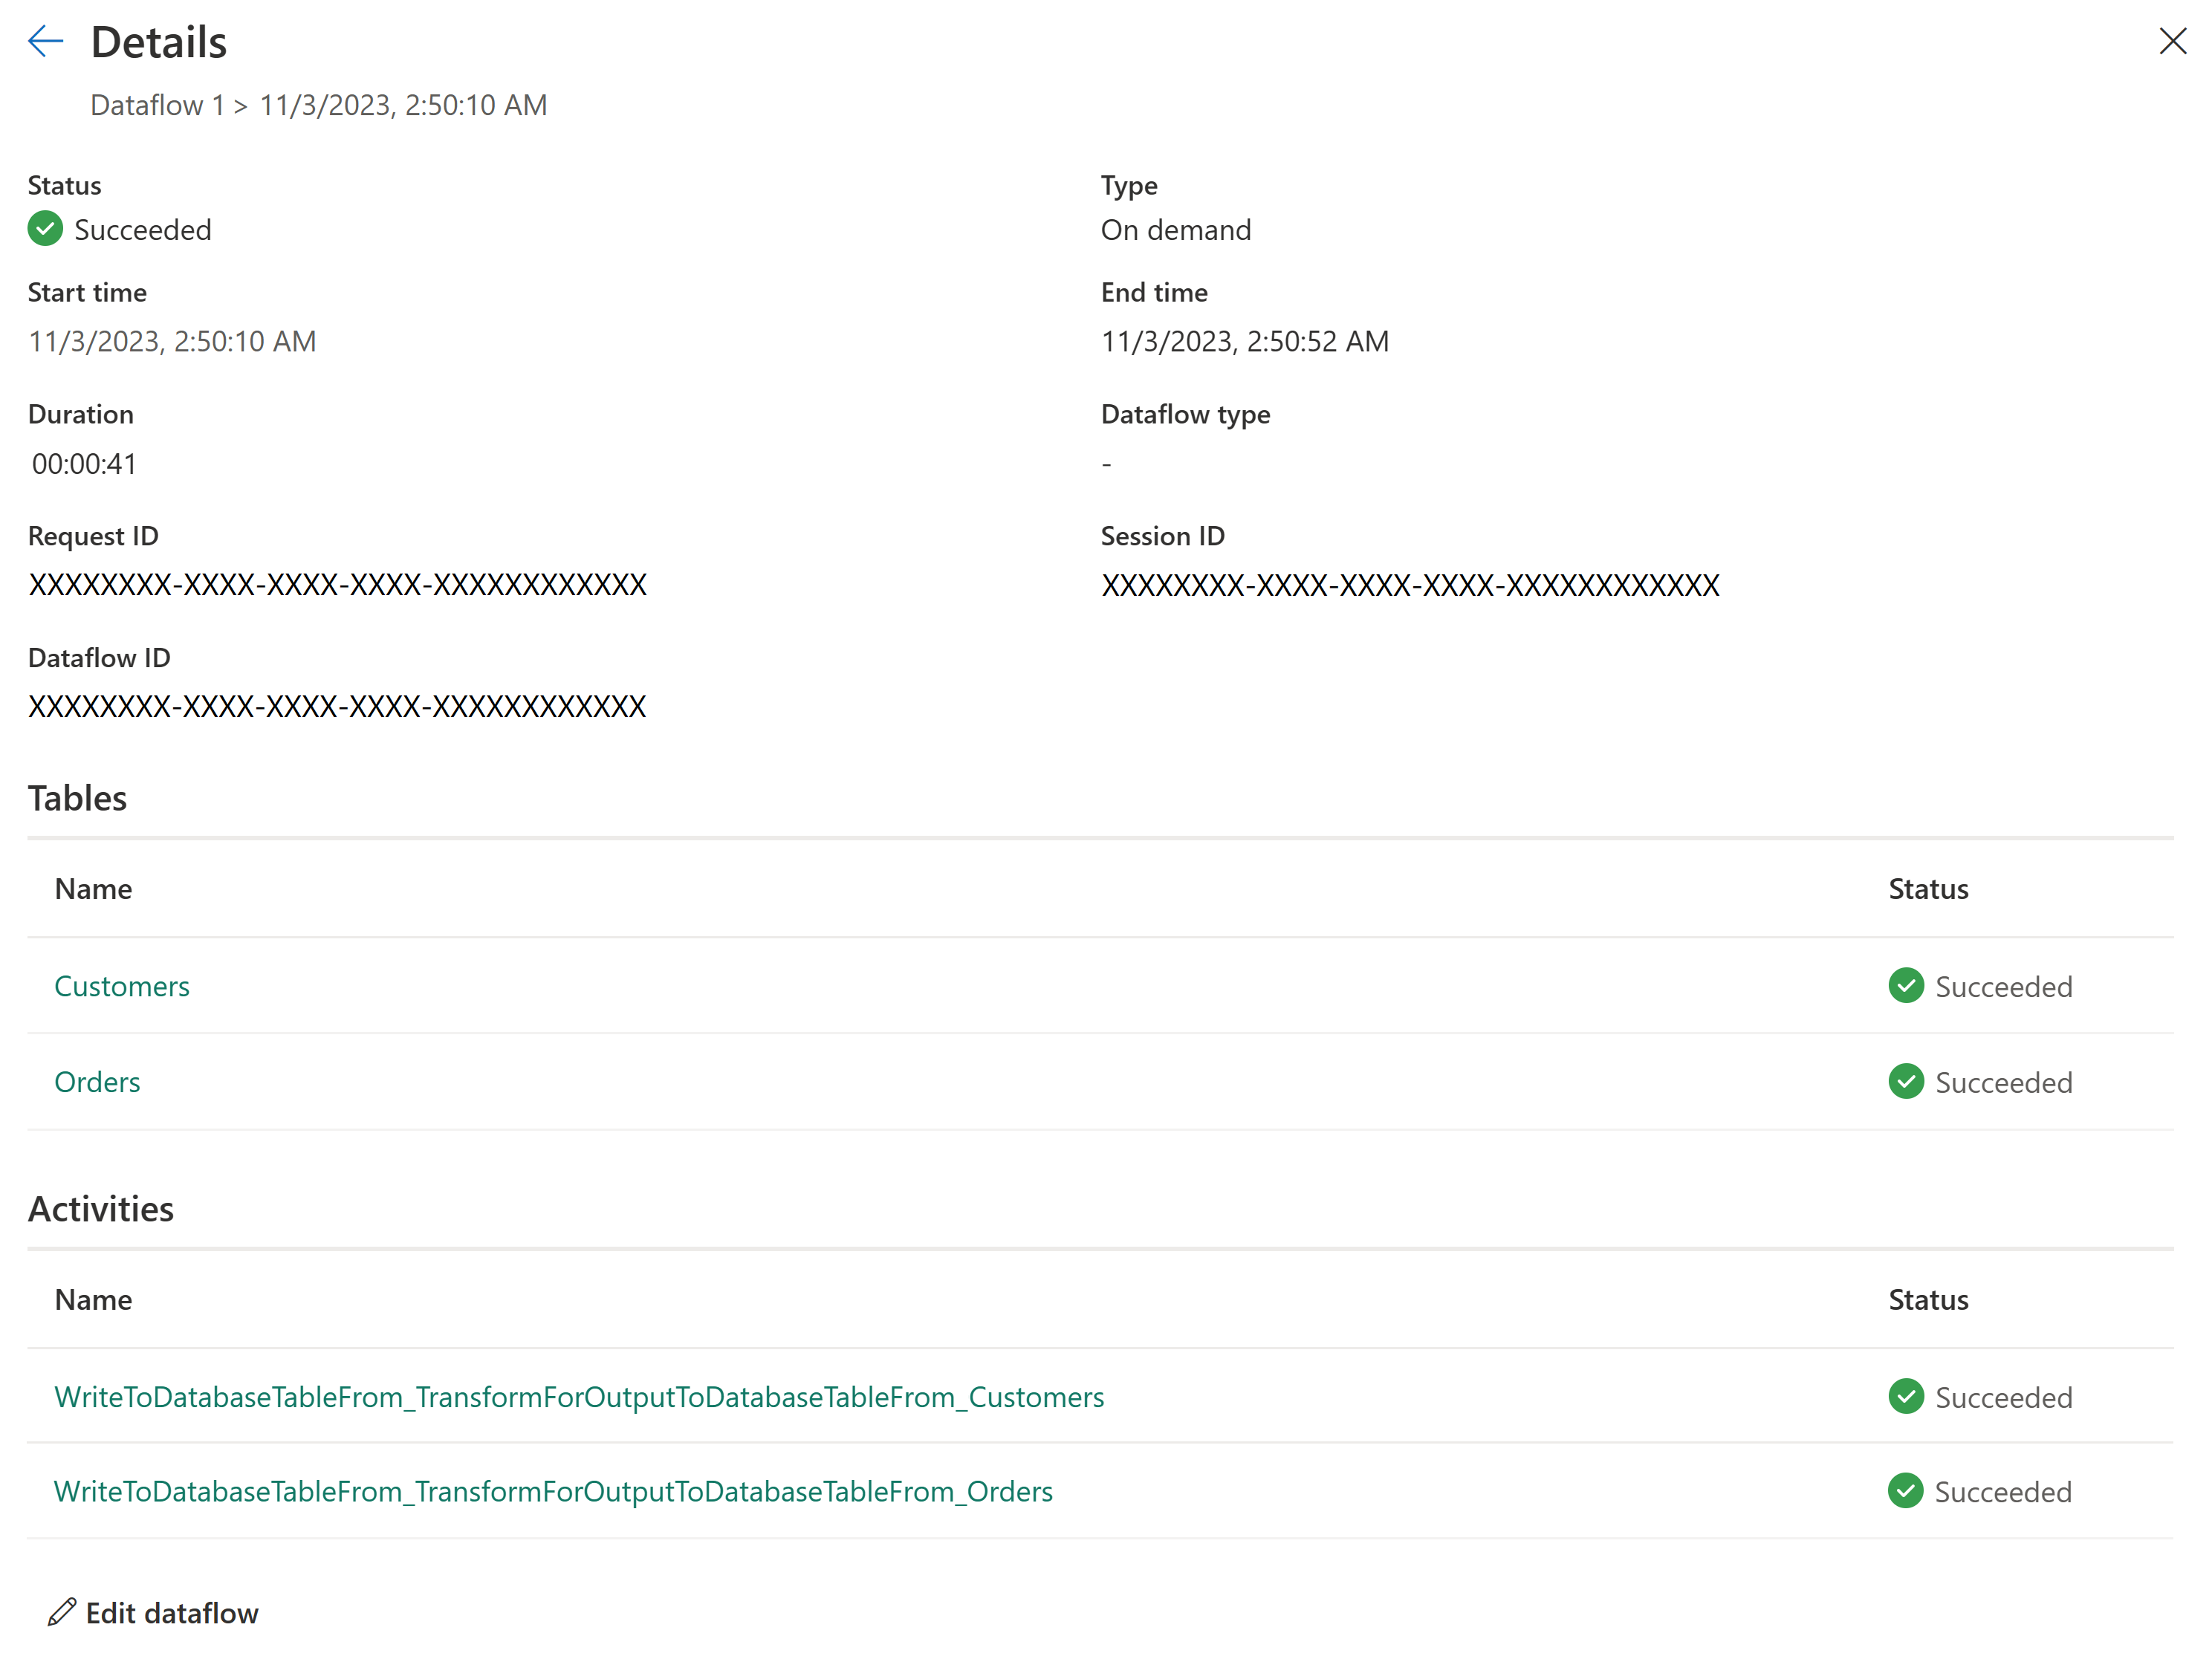
In short, this overview provides you:
- Status of the dataflow
- Type of refresh
- Start and End time
- Duration
- Request ID
- Session ID
- Dataflow ID
The Tables section reflects all the entities for which you enable loading in your dataflow. Meaning that those tables shown here are being loaded into the staging area of your dataflow. These tables are the entities you can access using the Power Query Dataflow connector in Power BI, Excel, or dataflows. You can select any of the listed table names to view the details of this specific table. Once you select the name, you arrive at the following Details screen:

The Activities section reflects all the actions that took place during the refresh, for example loading data to your output destination. This table also allows you to dive deeper into the details of the specific activity. By selecting the name of the activity, you arrive at the following Details screen:

This screen gives you more clarity in what happened during the activity. For example, for output destinations the activity screen provides you with the:
- Status of the Activity
- Start and End time
- Duration
- Activity statistics:
- Endpoints contacted
- Volume processed by the connector
- Bytes read
- Rows read
- Bytes written
- Rows written
- Volume processed by the connector
- Endpoints contacted
To investigate what happened, you can drill down into an activity or table. The following screen provides you with general information about the refresh and errors. If you're drilling into an activity, you're presented with how much data got processed and sent to your output destination. Some connectors report on the number of rows and some report on the number of bytes. The statistics are shown in the Activity statistics section.
Workspace status
In the workspace, you can view the status of all dataflows in your workspace. You can find this information in the Status column in the workspace view. The column shows the status of the last refresh and the last time changes were saved and validated. If either action fails, you see a red exclamation mark. Hover over the icon to get more details about the failure.

When the refresh failed, you can go into the refresh history to investigate what went wrong. When the save or validate action failed, you can open the dataflow in the dataflow editor to investigate what went wrong and run a validation from there.
Monitoring hub
The monitoring hub is available using the side menu. You can access it by selecting the Monitoring hub button.

The monitoring hub provides you with a dashboard that gives you an overview of the status of your dataflows.

This dashboard provides you with the following information:
- Status of your dataflows
- Start time of the refresh
- Refresh duration
- Submitter of the refresh
- Workspace name
- Fabric capacity used for the refresh of your dataflow
- Average refresh duration
- Number of refreshes per day
- Type of refresh