Gain insights into your app users’ activity
Applies to:  Workforce tenants
  External tenants (learn more)
The Application user activity feature under Usage & insights provides data analytics on user activity and engagement for registered applications in your tenant. You can use this feature to view, query, and analyze user activity data in the Microsoft Entra admin center. This feature can help you uncover valuable insights that can aid strategic decisions and drive business growth.
Tip
 To try out this feature, go to the Woodgrove Groceries demo and start the “Application user activity” use case.
Supported scenarios
You can use the user insights feature for the following scenarios:
- Tracking active users - You want to determine the total number of active users in your tenant, to assess the overall user engagement with your applications.
- Monitoring new users added - You want to track and identify how many users have been added to your tenant in the last month. This data is valuable for monitoring the growth of your user base.
- Analyzing daily and monthly application sign-ins - You want to gather data on the number of users who sign in to your applications daily and monthly to assess user engagement and spot trends.
- Assessing MFA usage success and failure - You want to compare the multifactor authentication (MFA) usage success and failure rates for your applications to provide insights into the security and user experience of your authentication processes. You can also use our new telecom metrics for MFA SMS and fraud detection. These preview metrics help you identify vulnerabilities and detect potential fraud.
Prerequisites
To access and view data from application user activity, you must have:
- A Microsoft Entra External ID external tenant.
- Registered application(s) with some sign-in and sign-up data.
How to access the Application user activity dashboards
The Application user activity dashboards provide insights into how users interact with your apps. You can access them from the Application user activity menu.
Sign in to the Microsoft Entra admin center as at least a Reports Reader.
If you have access to multiple tenants, use the Settings icon
 in the top menu to switch to the external tenant you created earlier from the Directories + subscriptions menu.
Browse to Identity > Monitoring & health > Usage & insights
Select Application user activity to view the dashboards.


Browse the available dashboards
There are three dashboards available with data centered around users, requests, and authentications. Each dashboard provides a summary of activities in applications with one or more sign-in attempts. The dashboards display activity data during the selected time range.
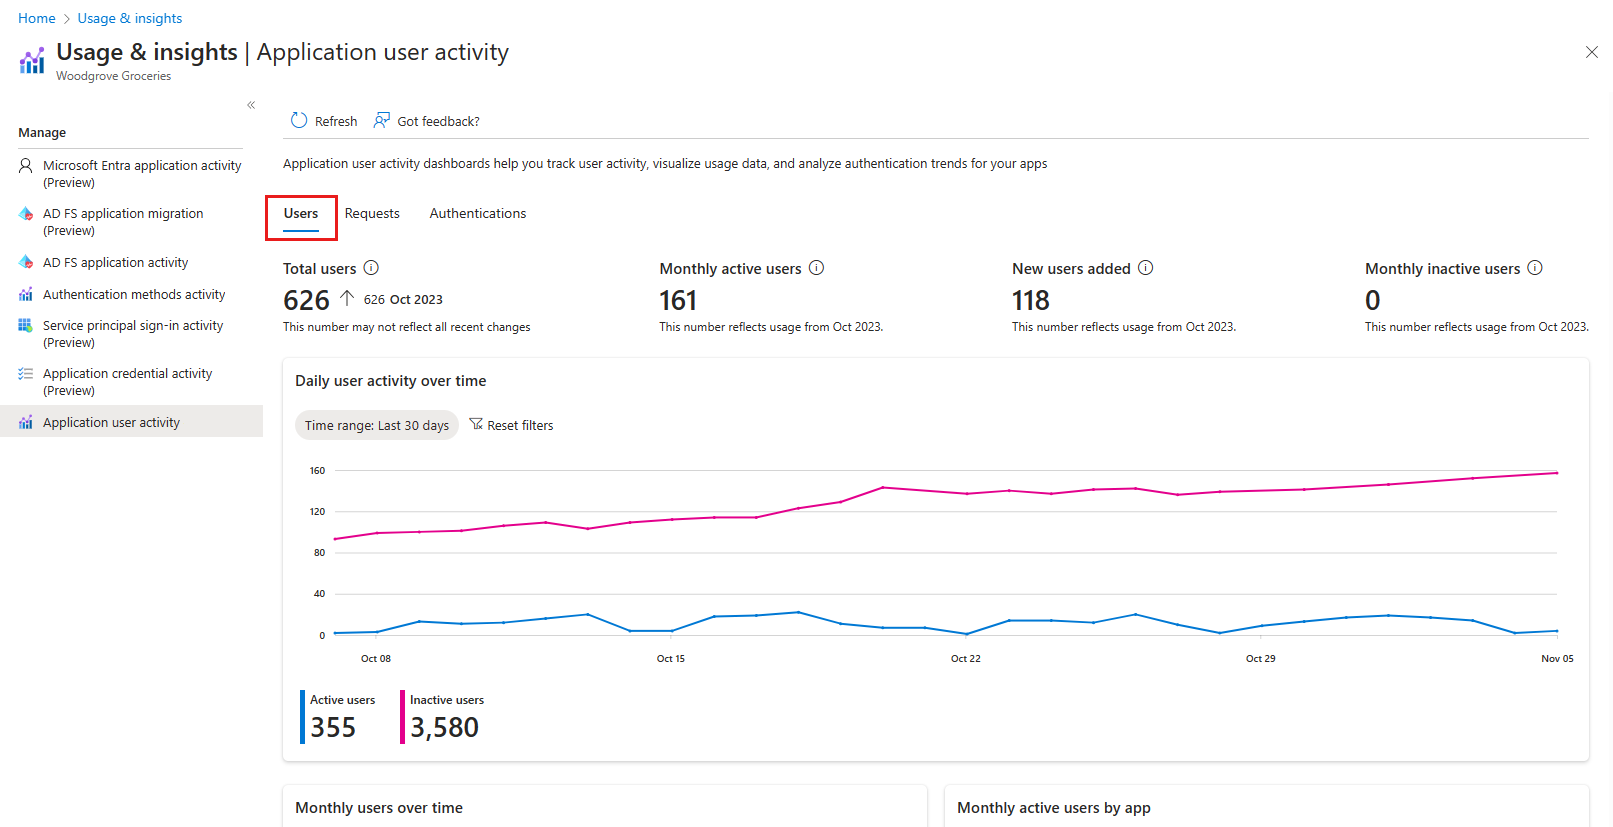
Users dashboard
The Users dashboard provides a summary of daily and monthly active users, and new users added to your tenant. For this dataset, you can view the following trends:
Daily active and inactive users over a period of 30 days.
Monthly active users over a period of 12 months
Monthly active users comparison by application.
New users added over a period of 12 months.
New users breakdown by operating system.
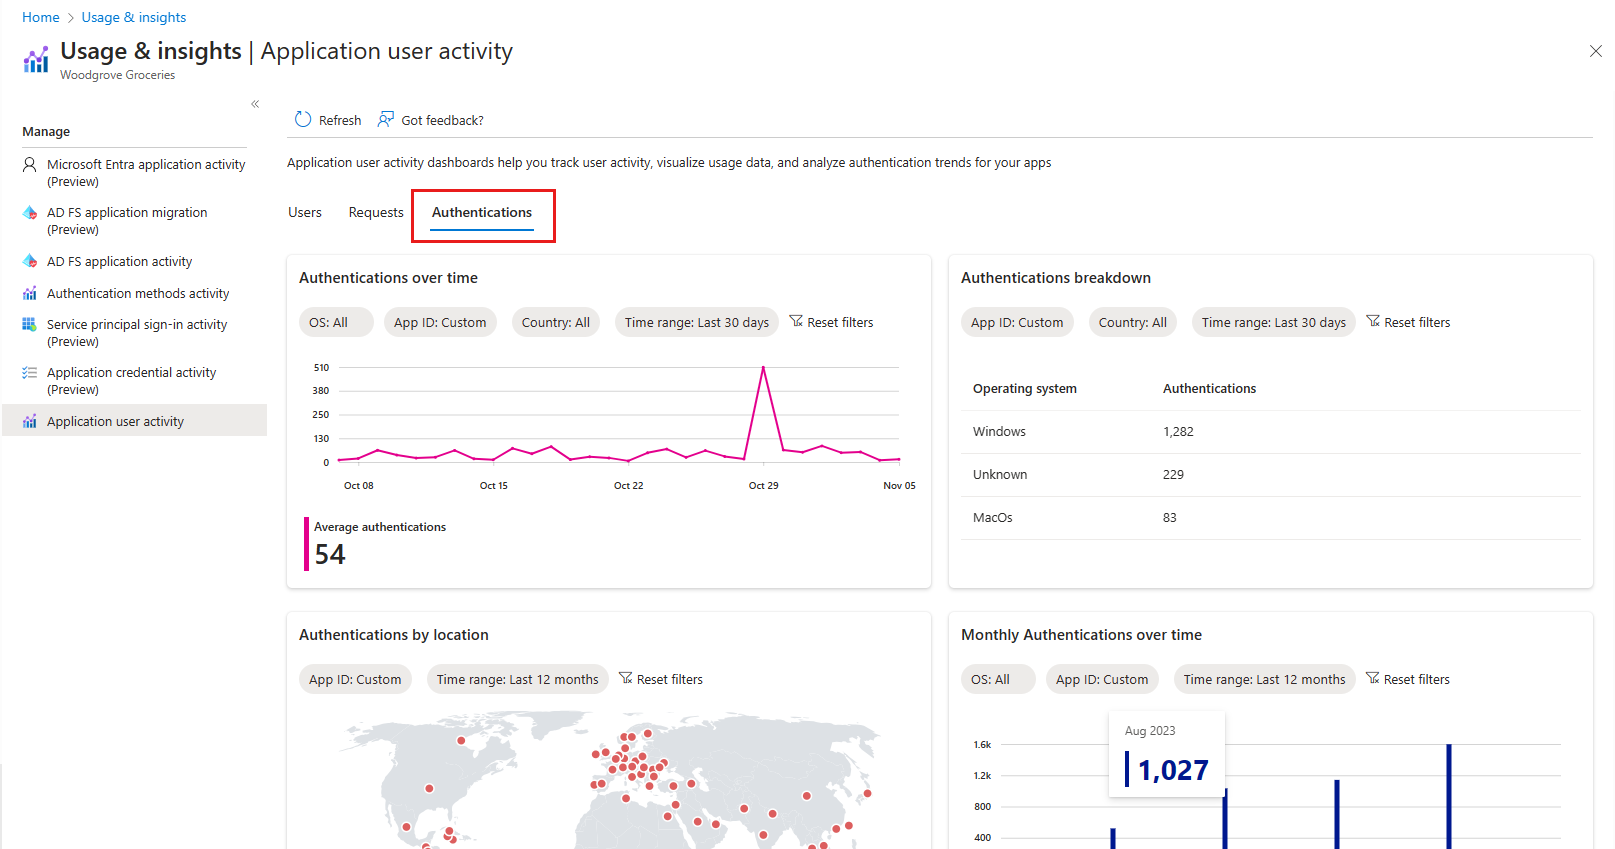
Authentications dashboard
The Authentications dashboard provides a summary of daily and monthly authentications in your tenant. For this dataset, you can view the following trends:
Daily authentications over a period of 30 days.
Daily authentications breakdown by operating system.
Monthly authentications over a period of 12 months summarized by location.
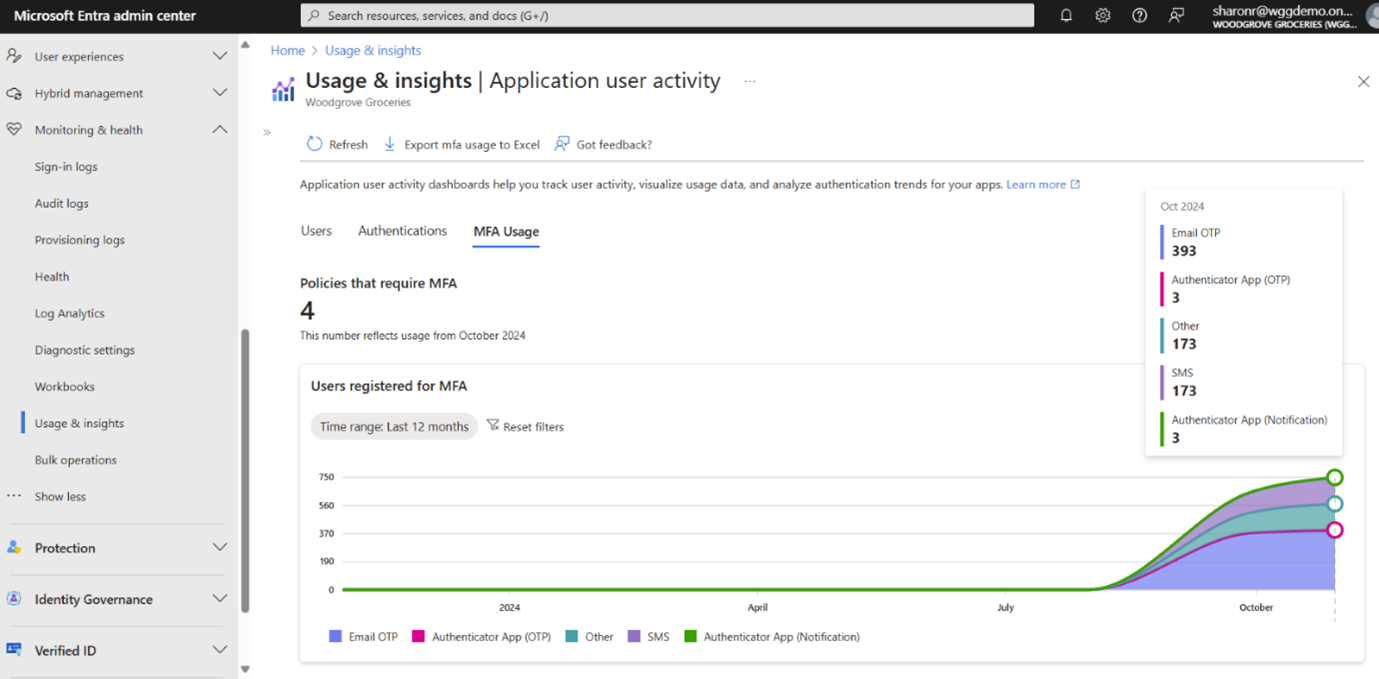
MFA Usage dashboard
The MFA Usage dashboard gives you a summary of monthly MFA authentication performance for all your applications. For this dataset, you can view the following trends:
Users registered for MFA
Types of MFA usage with a summary of success vs failure count over a period of 12 months
CAPTHA triggers and activity in the last 30 days
Telecom metrics (preview)
To better understand MFA performance, we have added new metrics to the MFA Usage dashboard. These metrics provide actionable insights into SMS-based MFA usage.
- Conditional Access (CA) policies requiring MFA: This metric helps you identify which CA policies require MFA, allowing you to pinpoint any security gaps.
- Number of users registered for MFA: This metric tracks how many users are registered for MFA and which methods they use. This information helps you evaluate the level of MFA adoption.
We have added several new metrics to help you detect potential telecom fraud. Microsoft Entra External ID uses CAPTCHA for SMS MFA to help to prevent automated attacks by distinguishing human users from bots. If a risky user is detected, we block the user from signing in or ask the user to complete a CAPTCHA before sending an SMS verification code. To help you visualize the effectiveness of this method, we have added the following metrics to the dashboard:
- Allowed: This metric shows the number of users who successfully received an SMS during sign-in or sign-up.
- Blocked: This metric shows the number of users who were prevented from receiving an SMS. When telecom MFA is blocked, users are notified and advised trying an alternative authentication method.
- Challenged: This metric shows when a CAPTCHA challenge appears before sending the SMS. This usually happens when unusual behavior is detected. For this data point, you'll also see the following metrics:
- Number of users unable to complete CAPTCHA: This metric helps you to track how many users couldn’t pass the CAPTCHA challenge. This insight helps assess if the CAPTCHA is too difficult for legitimate users, allowing adjustments to balance security with accessibility.
- Number of users successfully completing CAPTCHA: This metric helps you review how many users have successfully completed the CAPTCHA challenge. This data provides insight into how effectively CAPTCHA protects against automated attacks while ensuring legitimate users can authenticate.
Customize your dashboards
The Application user activity dashboards provide easy-to-digest graphs and charts but have limited customization options. These dashboards are available in the Microsoft Entra admin center and accessible via Microsoft Graph APIs, which are currently in beta.
Microsoft Graph APIs enable you to build powerful, customized dashboards tailored to your specific needs and preferences, offering several advantages:
- Flexibility: You can integrate with other data sources to present your data in a way that aligns more with your business objectives.
- Enhanced visualization: You can have richer and more interactive visual representations of your data.
- Complex query handling: You can apply advanced filters, aggregations, and calculations to your user insights data and get more granular and accurate results.
To build your own user insights dashboard, you need to configure API permissions for Microsoft Graph. You can then use the Microsoft Graph API to access the data and build custom reports in your preferred analytics tool. We recommend using Power BI to visualize the data, but you can choose any other analytical tool you prefer.
Configure API permissions
To build your own user insights dashboard, you need to configure API permissions for Microsoft Graph and add the Insights-UserMetric.Read.All permission to your registered app.
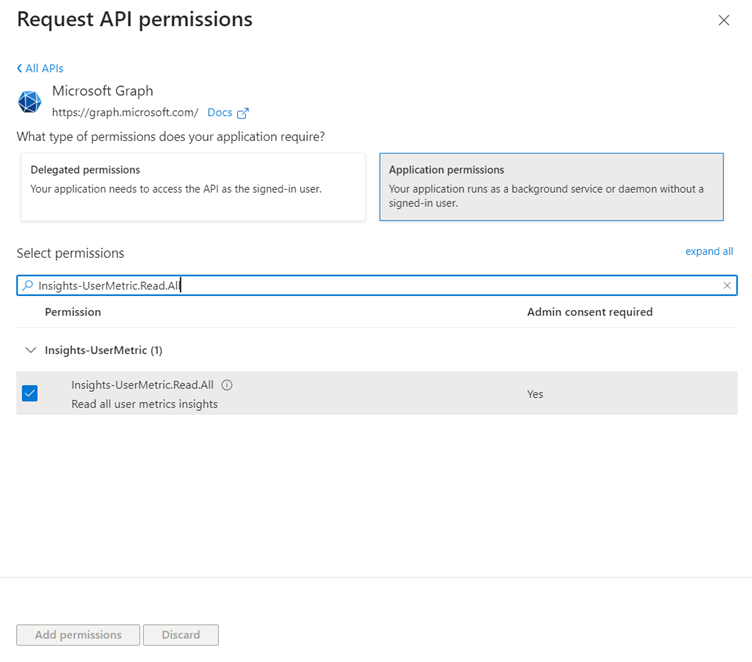
You also have to generate a client secret and get an access token to interact with Microsoft Graph.
Once you have successfully created your access token, you can use the Microsoft Graph API to access the data and build custom reports.
Create a custom Power BI report
To fetch the user insights data, you can create a Power BI report using custom connectors. Here's how you can do it:
- Create a new blank Power BI report.
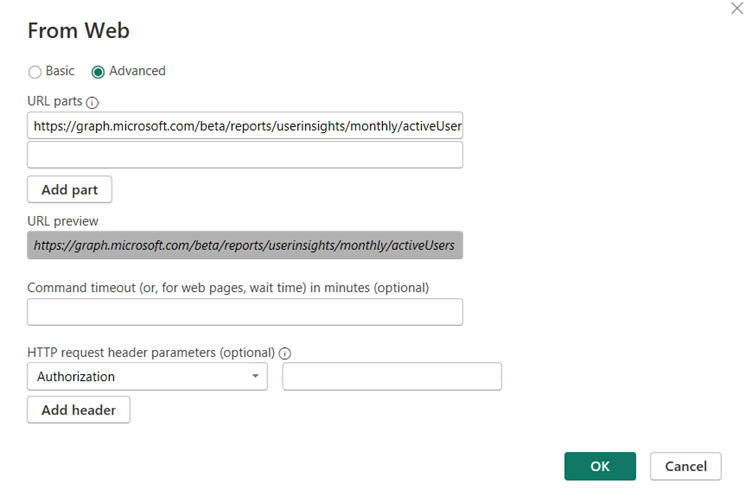
- Create a custom connector and enter the URL for the Microsoft Graph API endpoint you want to query. For example:
https://graph.microsoft.com/beta/reports/userinsights/monthly/activeUsersfor monthly active users data. - Add your access token by selecting Advanced.
- In the HTTP request header parameters (optional) section, select Authorization in the drop-down list and enter your access token.
- Select OK to connect Power BI to the Microsoft Graph API and load the data.
Power BI comes with Power Query Editor that can help you clean and shape your data. You can remove unnecessary columns, handle missing values, and apply transformations such as merging, grouping, filtering, and many more. For more information, see the Query Editor overview.