Note
Access to this page requires authorization. You can try signing in or changing directories.
Access to this page requires authorization. You can try changing directories.
Important
Azure Synapse Analytics Data Explorer (Preview) will be retired on October 7, 2025. After this date, workloads running on Synapse Data Explorer will be deleted, and the associated application data will be lost. We highly recommend migrating to Eventhouse in Microsoft Fabric.
The Microsoft Cloud Migration Factory (CMF) program is designed to assist customers in migrating to Fabric. The program offers hands-on keyboard resources at no cost to the customer. These resources are assigned for a period of 6-8 weeks, with a predefined and agreed-upon scope. Customer nominations are accepted from the Microsoft account team or directly by submitting a request for help to the CMF team.
With Azure Synapse Analytics, you can use Data Explorer to run queries, dashboards and more on Data Explorer pools in your workspace.
This article explains how to monitor your Data Explorer pools, allowing you to keep an eye on the status of your pools, including how many vCores are in use by different workspace users.
Access Data Explorer pools list
To see the list of Data Explorer pools in your workspace, first open the Synapse Studio and select your workspace.
Once you've opened your workspace, select the Monitor section on the left.
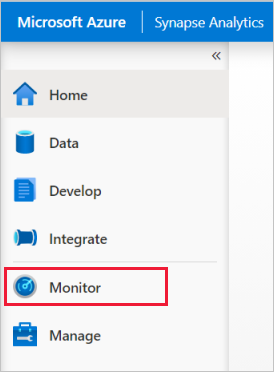
Select Data Explorer pools to view the list of Data Explorer pools.
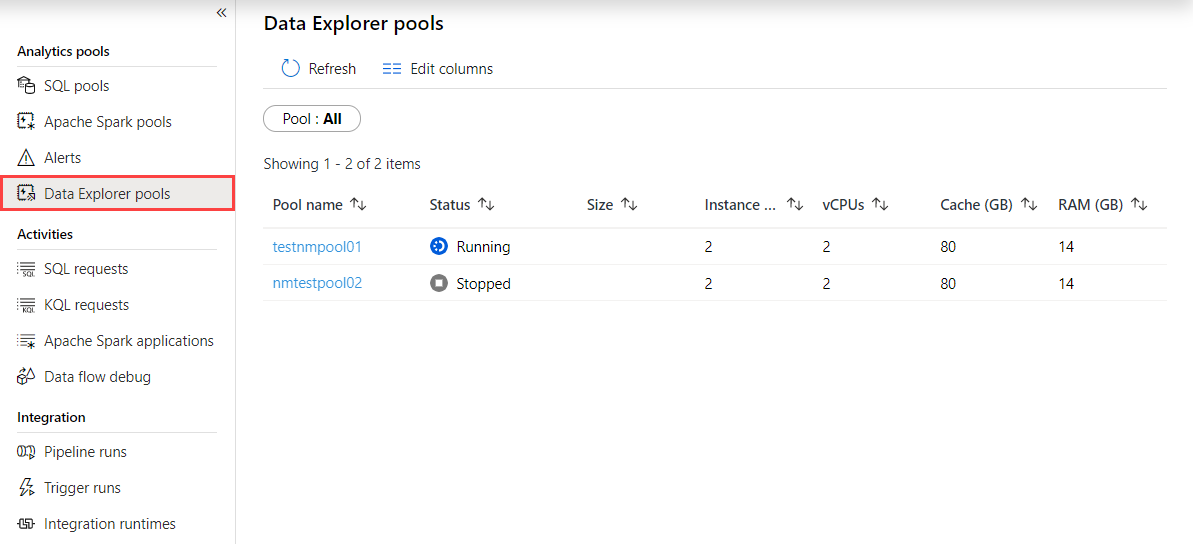
Filter your Data Explorer pools
You can filter the list of Data Explorer pools to the ones that interest you. The filters at the top of the screen allow you to specify a field on which you'd like to filter.
For example, you can filter the view to see only the Data Explorer pools containing the name "test":

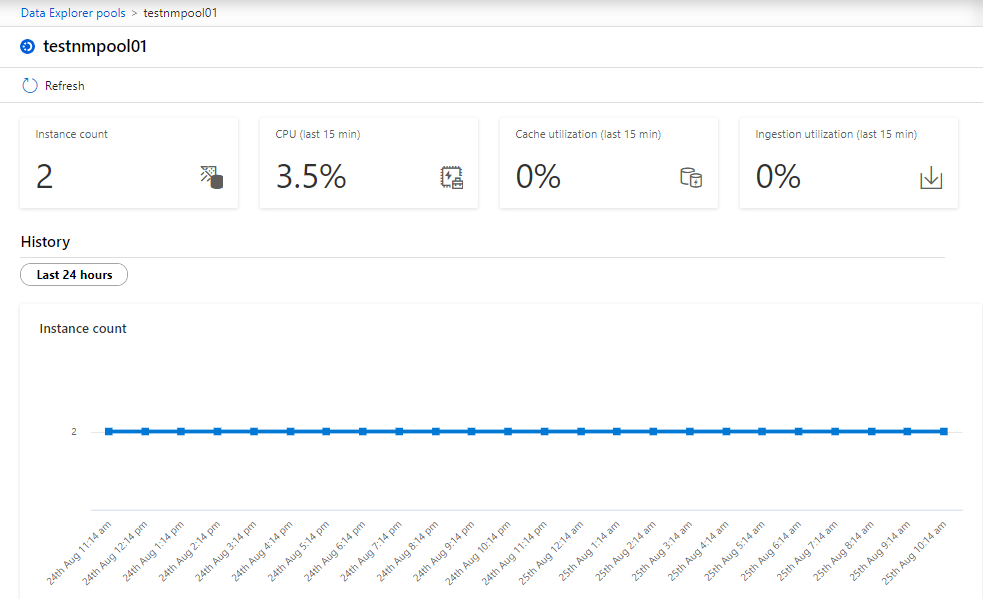
View details about a specific Data Explorer pool
To view the details about one of your Data Explorer pools, select the Data Explorer pool to view the details.