Note
Access to this page requires authorization. You can try signing in or changing directories.
Access to this page requires authorization. You can try changing directories.
This article provides code snippets that show how to query the Microsoft Sentinel data lake using Jupyter notebooks. The examples cover data from tables such as Microsoft Entra ID sign-in logs, group details, and device network events. Each snippet is designed to run in a Jupyter notebook in Visual Studio Code with the Microsoft Sentinel extension.
To run these examples, you must have the required permissions and Visual Studio Code installed with the Microsoft Sentinel extension. For more information, see Microsoft Sentinel data lake permissions and Use Jupyter notebooks with Microsoft Sentinel data lake.
Failed sign-in attempts analysis
This example identifies users with failed sign-in attempts. To find these users, the notebook processes sign-in data from two tables:
- SigninLogs
- AADNonInteractiveUserSignInLogs
The notebook performs the following steps:
- Create a function to process data from the specified tables, which includes:
- Load data from the specified tables into DataFrames.
- Parse the 'Status' JSON field to extract 'errorCode' and determine whether each sign-in attempt was a success or failure.
- Aggregate the data to count the number of failed and successful sign-in attempts for each user.
- Filter the data to include only users with more than 100 failed sign-in attempts and at least one successful sign-in attempt.
- Order the results by the number of failed sign-in attempts.
- Call the function for both
SigninLogsandAADNonInteractiveUserSignInLogstables. - Combine the results from both tables into a single DataFrame.
- Convert the DataFrame to a Pandas DataFrame.
- Filter the Pandas DataFrame to show the top 20 users with the highest number of failed sign-in attempts.
- Create a bar chart to visualize the users with the highest number of failed sign-in attempts.
Note
This notebook takes around 10 minutes to run on the Large pool depending on the volume of data in the logs tables
# Import necessary libraries
import matplotlib.pyplot as plt
from sentinel_lake.providers import MicrosoftSentinelProvider
from pyspark.sql.functions import col, when, count, from_json, desc
from pyspark.sql.types import StructType, StructField, StringType

data_provider = MicrosoftSentinelProvider(spark)

# Function to process data
def process_data(table_name,workspace_name):
    # Load data into DataFrame
    df = data_provider.read_table(table_name, workspace_name)

    # Define schema for parsing the 'Status' JSON field
    status_schema = StructType([StructField("errorCode", StringType(), True)])
    # Parse the 'Status' JSON field to extract 'errorCode'
    df = df.withColumn("Status_json", from_json(col("Status"), status_schema)) \
           .withColumn("ResultType", col("Status_json.errorCode"))
    # Define success codes
    success_codes = ["0", "50125", "50140", "70043", "70044"]

    # Determine FailureOrSuccess based on ResultType
    df = df.withColumn("FailureOrSuccess", when(col("ResultType").isin(success_codes), "Success").otherwise("Failure"))

    # Summarize FailureCount and SuccessCount
    df = df.groupBy("UserPrincipalName", "UserDisplayName", "IPAddress") \
           .agg(count(when(col("FailureOrSuccess") == "Failure", True)).alias("FailureCount"),
                count(when(col("FailureOrSuccess") == "Success", True)).alias("SuccessCount"))

    # Filter where FailureCount > 100 and SuccessCount > 0
    df = df.filter((col("FailureCount") > 100) & (col("SuccessCount") > 0))

    # Order by FailureCount descending
    df = df.orderBy(desc("FailureCount"))

    return df

# Process the tables to a common schema
workspace_name = "your-workspace-name"  # Replace with your actual workspace name
aad_signin = process_data("SigninLogs", workspace_name)
aad_non_int = process_data("AADNonInteractiveUserSignInLogs", workspace_name)

# Union the DataFrames
result_df = aad_signin.unionByName(aad_non_int)

# Show the result
result_df.show()

# Convert the Spark DataFrame to a Pandas DataFrame
result_pd_df = result_df.toPandas()

# Filter to show table with top 20 users with the highest failed sign-ins attempted
top_20_df = result_pd_df.nlargest(20, 'FailureCount')

# Create bar chart to show users by highest failed sign-ins attempted
plt.figure(figsize=(12, 6))
plt.bar(top_20_df['UserDisplayName'], top_20_df['FailureCount'], color='skyblue')
plt.xlabel('Users')
plt.ylabel('Number of Failed sign-ins')
plt.title('Top 20 Users with Failed sign-ins')
plt.xticks(rotation=45, ha='right')
plt.tight_layout()
plt.show()
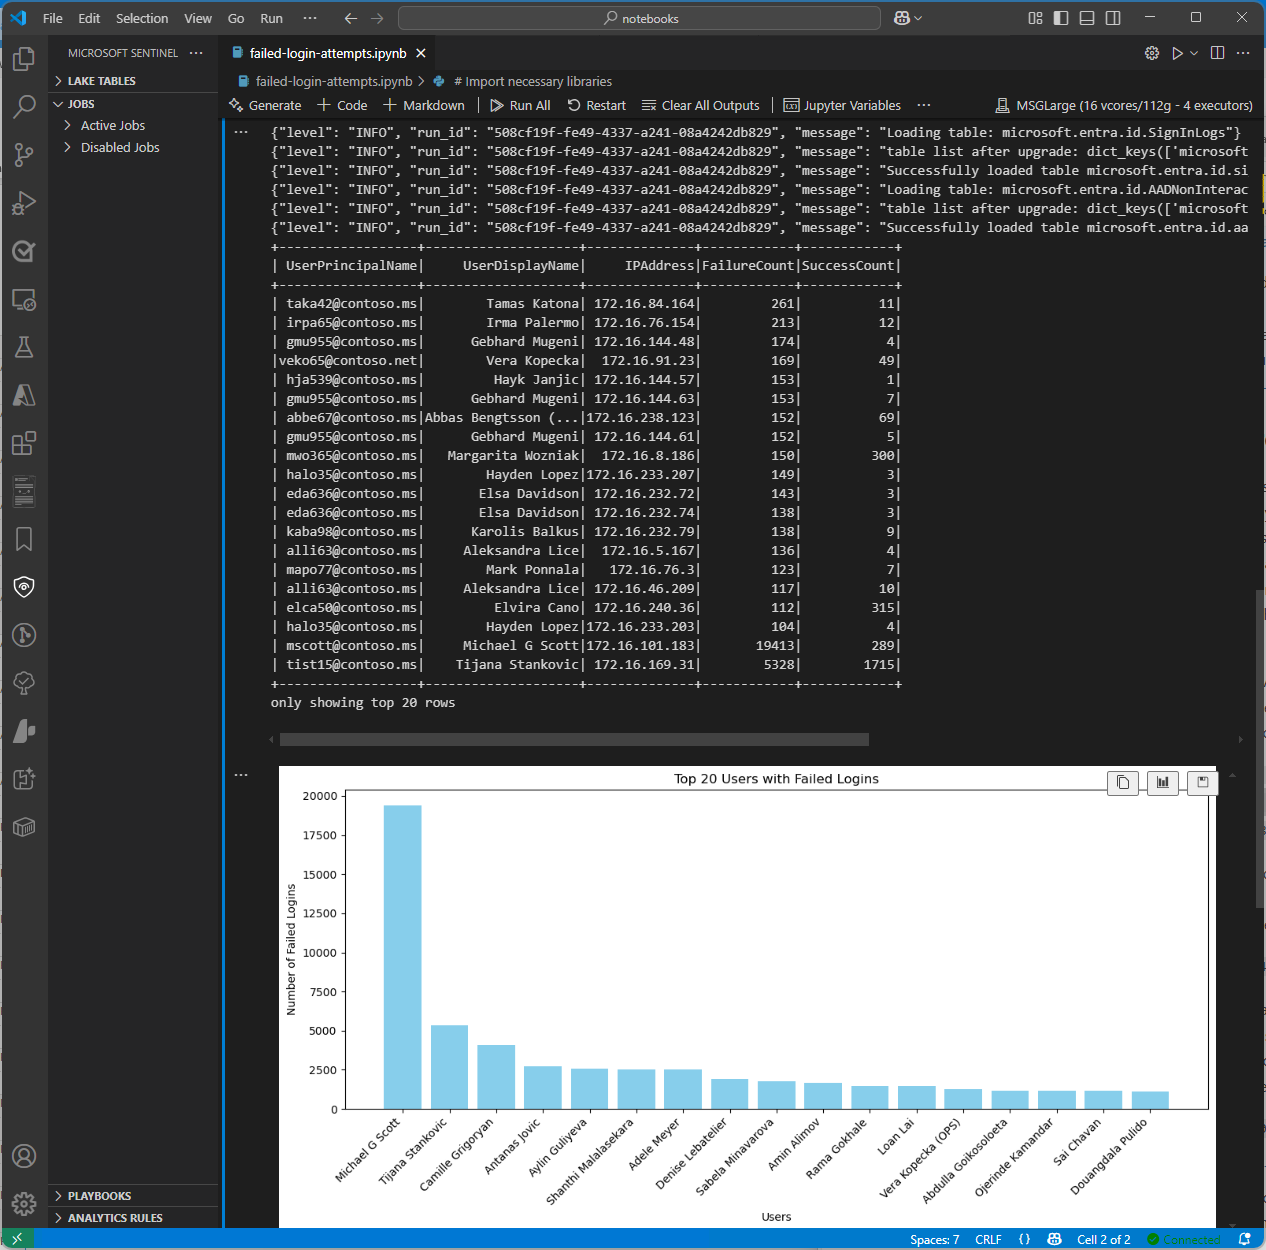
The following screenshot shows sample output from the failed sign-in analysis code sample, displaying the top 20 users with the highest number of failed sign-in attempts in a bar chart format.
Query the EntraGroups table
This sample reads the EntraGroups table. It returns group details such as name, type, mail, and tenant ID.
from sentinel_lake.providers import MicrosoftSentinelProvider
data_provider = MicrosoftSentinelProvider(spark)

table_name = "EntraGroups"
df = data_provider.read_table(table_name)
df.select("displayName", "groupTypes", "mail", "mailNickname", "description", "tenantId").show(100, truncate=False)
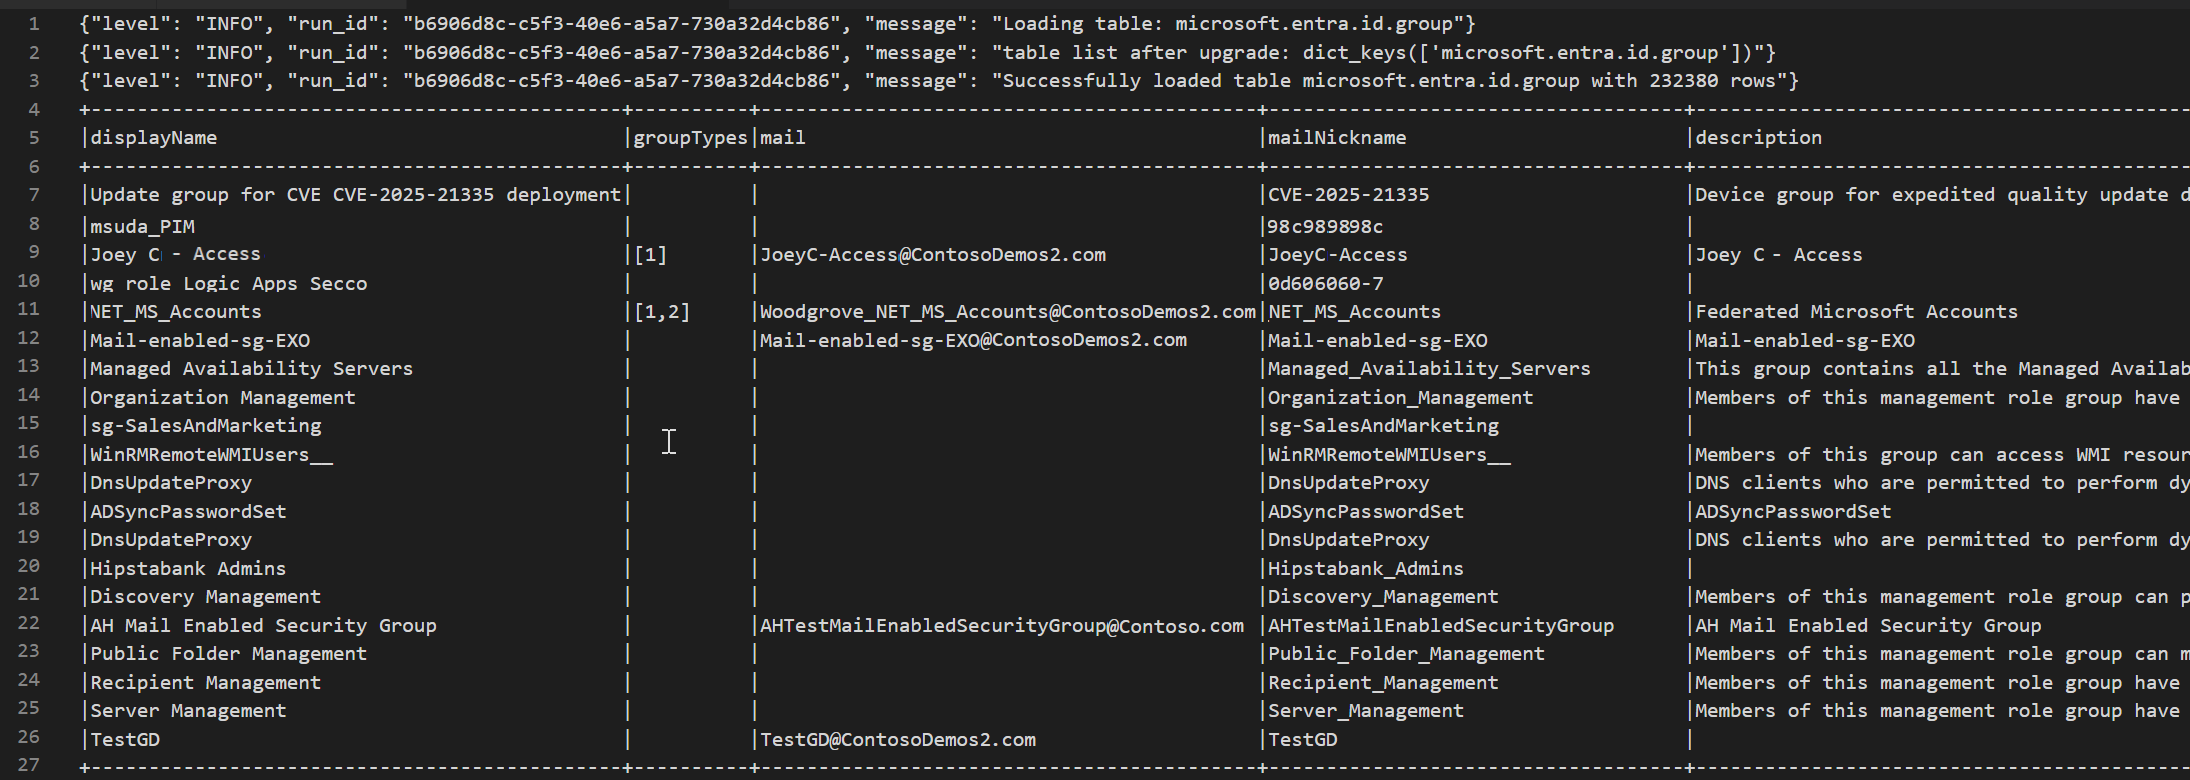
The following screenshot shows sample output from the EntraGroups table query code sample, displaying the Microsoft Entra ID group information in a dataframe format.
Access Microsoft Entra ID sign-in logs for a specific user
This sample queries the SigninLogs table and filters results for a specific user. It returns fields like UserDisplayName, UserPrincipalName, and UserId.
from sentinel_lake.providers import MicrosoftSentinelProvider
data_provider = MicrosoftSentinelProvider(spark)

table_name = "SigninLogs"
workspace_name = "your-workspace-name"  # Replace with your actual workspace name
df = data_provider.read_table(table_name, workspace_name)
df.select("UserDisplayName", "UserPrincipalName", "UserId", "CorrelationId", "UserType",
 "ResourceTenantId", "RiskLevelDuringSignIn", "ResourceProvider", "IPAddress", "AppId", "AADTenantId")\
    .filter(df.UserPrincipalName == "bploni5@contoso.com")\
    .show(100, truncate=False)
Examine sign-in locations
The following code sample demonstrates how to extract and display sign-in locations from the Microsoft Entra ID SigninLogs table. It uses the from_json function to parse the JSON structure of the LocationDetails field, allowing you to access specific location attributes such as city, state, and country or region.
from sentinel_lake.providers import MicrosoftSentinelProvider
from pyspark.sql.functions import from_json, col
from pyspark.sql.types import StructType, StructField, StringType

data_provider = MicrosoftSentinelProvider(spark)
workspace_name = "your-workspace-name"  # Replace with your actual workspace name
table_name = "SigninLogs"
df = data_provider.read_table(table_name, workspace_name)

location_schema = StructType([
  StructField("city", StringType(), True),
  StructField("state", StringType(), True),
  StructField("countryOrRegion", StringType(), True)
])

# Extract location details from JSON
df = df.withColumn("LocationDetails", from_json(col("LocationDetails"), location_schema))
df = df.select("UserPrincipalName", "CreatedDateTime", "IPAddress",
 "LocationDetails.city", "LocationDetails.state", "LocationDetails.countryOrRegion")

sign_in_locations_df = df.orderBy("CreatedDateTime", ascending=False)
sign_in_locations_df.show(100, truncate=False)
Sign-ins from unusual countries
The following code sample demonstrates how to identify sign-ins from countries that aren't part of a user’s typical sign-in pattern.
from sentinel_lake.providers import MicrosoftSentinelProvider
from pyspark.sql.functions import from_json, col
from pyspark.sql.types import StructType, StructField, StringType

data_provider = MicrosoftSentinelProvider(spark)
table_name = "signinlogs"
workspace_name = "your-workspace-name"  # Replace with your actual workspace name
df = data_provider.read_table(table_name, workspace_name)

location_schema = StructType([
    StructField("city", StringType(), True),
    StructField("state", StringType(), True),
    StructField("countryOrRegion", StringType(), True)
])

# Extract location details from JSON
df = df.withColumn("LocationDetails", from_json(col("LocationDetails"), location_schema))
df = df.select(
    "UserPrincipalName",
    "CreatedDateTime",
    "IPAddress",
    "LocationDetails.city",
    "LocationDetails.state",
    "LocationDetails.countryOrRegion"
)

sign_in_locations_df = df.orderBy("CreatedDateTime", ascending=False)
sign_in_locations_df.show(100, truncate=False)
Brute force attack from multiple failed sign-ins
Identify potential brute force attacks by analyzing user sign-in logs for accounts with a high number of failed sign-in attempts.
from sentinel_lake.providers import MicrosoftSentinelProvider
from pyspark.sql.functions import col, when, count, from_json, desc
from pyspark.sql.types import StructType, StructField, StringType

data_provider = MicrosoftSentinelProvider(spark)

def process_data(table_name, workspace_name):
    df = data_provider.read_table(table_name, workspace_name)
    status_schema = StructType([StructField("errorCode", StringType(), True)])
    df = df.withColumn("Status_json", from_json(col("Status"), status_schema)) \
           .withColumn("ResultType", col("Status_json.errorCode"))
    success_codes = ["0", "50125", "50140", "70043", "70044"]
    df = df.withColumn("FailureOrSuccess", when(col("ResultType").isin(success_codes), "Success").otherwise("Failure"))
    df = df.groupBy("UserPrincipalName", "UserDisplayName", "IPAddress") \
           .agg(count(when(col("FailureOrSuccess") == "Failure", True)).alias("FailureCount"),
                count(when(col("FailureOrSuccess") == "Success", True)).alias("SuccessCount"))
    # Lower the brute force threshold to >10 failures and remove the success requirement
    df = df.filter(col("FailureCount") > 10)
    df = df.orderBy(desc("FailureCount"))
    df = df.withColumn("AccountCustomEntity", col("UserPrincipalName")) \
           .withColumn("IPCustomEntity", col("IPAddress"))
    return df
workspace_name = "your-workspace-name"  # Replace with your actual workspace name
aad_signin = process_data("SigninLogs", workspace_name)
aad_non_int = process_data("AADNonInteractiveUserSignInLogs",workspace_name)
result_df = aad_signin.unionByName(aad_non_int)
result_df.show()
Detect lateral movement attempts
Use DeviceNetworkEvents to find internal-to-internal connections with high connection counts, which may signal lateral movement. You can adjust the connection-count threshold or add port filters to narrow results to specific protocols.
from sentinel_lake.providers import MicrosoftSentinelProvider
from pyspark.sql.functions import col, count, countDistinct, desc

deviceNetworkEventTable = "DeviceNetworkEvents"
workspace_name = "<your-workspace-name>"  # Replace with your actual workspace name
data_provider = MicrosoftSentinelProvider(spark)
device_network_events = data_provider.read_table(deviceNetworkEventTable, workspace_name)

# Define internal IP address range (example: 10.x.x.x, 192.168.x.x, 172.16.x.x - 172.31.x.x)
internal_ip_regex = r"^(10\.\d{1,3}\.\d{1,3}\.\d{1,3}|192\.168\.\d{1,3}\.\d{1,3}|172\.(1[6-9]|2[0-9]|3[0-1])\.\d{1,3}\.\d{1,3})$"

# Filter for internal-to-internal connections
internal_connections = device_network_events.filter(
    col("RemoteIP").rlike(internal_ip_regex) &
    col("LocalIP").rlike(internal_ip_regex)
)

# Group by source and destination, count connections
suspicious_lateral = (
    internal_connections.groupBy("LocalIP", "RemoteIP", "InitiatingProcessAccountName")
    .agg(count("*").alias("ConnectionCount"))
    .filter(col("ConnectionCount") > 10)  # Threshold can be adjusted
    .orderBy(desc("ConnectionCount"))
)
suspicious_lateral.show()
Uncover credential dumping tools
Query DeviceProcessEvents to find known credential-dumping tools or suspicious processes that interact with lsass.exe, which could indicate credential harvesting.
from sentinel_lake.providers import MicrosoftSentinelProvider
from pyspark.sql.functions import col, lower

workspace_id = "<your-workspace-name>"
device_process_table = "DeviceProcessEvents"

data_provider = MicrosoftSentinelProvider(spark)
process_events = data_provider.read_table(device_process_table, workspace_id)

# Look for known credential dumping tools and suspicious access to lsass.exe
suspicious_processes = process_events.filter(
    (lower(col("FileName")).rlike("mimikatz|procdump|lsassy|nanodump|sekurlsa|dumpert")) |
    (
        (lower(col("FileName")) == "lsass.exe") &
        (~lower(col("InitiatingProcessFileName")).isin(["services.exe", "wininit.exe", "taskmgr.exe"]))
    )
)

suspicious_processes.select(
    "Timestamp",
    "DeviceName",
    "AccountName",
    "FileName",
    "FolderPath",
    "InitiatingProcessFileName",
    "InitiatingProcessCommandLine"
).show(50, truncate=False)
Correlation of USB activity with sensitive file access
Combine DeviceEvents and DeviceFileEvents in a notebook to surface potential data exfiltration patterns. Add visualizations to show which devices, users, or files were involved, and when.
from sentinel_lake.providers import MicrosoftSentinelProvider
from pyspark.sql.functions import col, lower, to_timestamp, expr
import matplotlib.pyplot as plt

data_provider = MicrosoftSentinelProvider(spark)
workspace_id = “<your-workspace-id>”

# Load DeviceEvents and DeviceFileEvents tables
device_events = data_provider.read_table("DeviceEvents", workspace_id)
device_file_events = data_provider.read_table("DeviceFileEvents", workspace_id)
device_info = data_provider.read_table("DeviceInfo", workspace_id)

# Filter for USB device activity (adjust 'ActionType' or 'AdditionalFields' as needed)
usb_events = device_events.filter(
    lower(col("ActionType")).rlike("usb|removable|storage")
)

# Filter for sensitive file access (e.g., files in Documents, Desktop, or with sensitive extensions)
sensitive_file_events = device_file_events.filter(
    lower(col("FolderPath")).rlike("documents|desktop|finance|confidential|secret|sensitive") |
    lower(col("FileName")).rlike(r"\.(docx|xlsx|pdf|csv|zip|7z|rar|pst|bak)$")
)

# Convert timestamps
usb_events = usb_events.withColumn("EventTime", to_timestamp(col("Timestamp")))
sensitive_file_events = sensitive_file_events.withColumn("FileEventTime", to_timestamp(col("Timestamp")))

# Join on DeviceId and time proximity (within 10 minutes) using expr for column operations
joined = usb_events.join(
    sensitive_file_events,
    (usb_events.DeviceId == sensitive_file_events.DeviceId) &
    (expr("abs(unix_timestamp(EventTime) - unix_timestamp(FileEventTime)) <= 600")),
    "inner"
) \
.join(device_info, usb_events.DeviceId == device_info.DeviceId, "inner")


# Select relevant columns
correlated = joined.select(
    device_info.DeviceName,
    usb_events.DeviceId,
    usb_events.AccountName,
    usb_events.EventTime.alias("USBEventTime"),
    sensitive_file_events.FileName,
    sensitive_file_events.FolderPath,
    sensitive_file_events.FileEventTime
)

correlated.show(50, truncate=False)

# Visualization: Number of sensitive file accesses per device
pd_df = correlated.toPandas()
if not pd_df.empty:
    plt.figure(figsize=(12, 6))
    pd_df.groupby('DeviceName').size().sort_values(ascending=False).head(10).plot(kind='bar')
    plt.title('Top Devices with Correlated USB and Sensitive File Access Events')
    plt.xlabel('DeviceName')
    plt.ylabel('Number of Events')
    plt.tight_layout()
    plt.show()
else:
    print("No correlated USB and sensitive file access events found in the selected period.")
Beacon behavior detection
Detect potential command-and-control by clustering regular outbound connections at low byte volumes over long durations.
# Setup
from pyspark.sql.functions import col, to_timestamp, window, count, avg, stddev, hour, date_trunc
from sentinel_lake.providers import MicrosoftSentinelProvider
import matplotlib.pyplot as plt
import pandas as pd

data_provider = MicrosoftSentinelProvider(spark)
device_net_events = "DeviceNetworkEvents"
workspace_id = "<your-workspace-id>"

network_df = data_provider.read_table(device_net_events, workspace_id)

# Add hour bucket to group by frequency
network_df = network_df.withColumn("HourBucket", date_trunc("hour", col("Timestamp")))

# Group by device and IP to count hourly traffic
hourly_traffic = network_df.groupBy("DeviceName", "RemoteIP", "HourBucket") \
    .agg(count("*").alias("ConnectionCount"))

# Count number of hours this IP talks to device
stats_df = hourly_traffic.groupBy("DeviceName", "RemoteIP") \
    .agg(
        count("*").alias("HoursSeen"),
        avg("ConnectionCount").alias("AvgConnPerHour"),
        stddev("ConnectionCount").alias("StdDevConnPerHour")
    )

# Filter beacon-like traffic: low stddev, repeated presence
beacon_candidates = stats_df.filter(
    (col("HoursSeen") > 10) &
    (col("AvgConnPerHour") < 5) &
    (col("StdDevConnPerHour") < 1.0)
)

beacon_candidates.show(truncate=False)

# Choose one Device + IP pair to plot
example = beacon_candidates.limit(1).collect()[0]
example_device = example["DeviceName"]
example_ip = example["RemoteIP"]

# Filter hourly traffic for that pair
example_df = hourly_traffic.filter(
    (col("DeviceName") == example_device) &
    (col("RemoteIP") == example_ip)
).orderBy("HourBucket")

# Convert to Pandas and plot
example_pd = example_df.toPandas()
example_pd["HourBucket"] = pd.to_datetime(example_pd["HourBucket"])

plt.figure(figsize=(12, 5))
plt.plot(example_pd["HourBucket"], example_pd["ConnectionCount"], marker="o", linestyle="-")
plt.title(f"Outbound Connections – {example_device} to {example_ip}")
plt.xlabel("Time (Hourly)")
plt.ylabel("Connection Count")
plt.grid(True)
plt.tight_layout()
plt.show()