Note
Access to this page requires authorization. You can try signing in or changing directories.
Access to this page requires authorization. You can try changing directories.
Tracking is the process of saving relevant information about experiments. In this article, you learn how to use MLflow for tracking experiments and runs in Azure Machine Learning workspaces.
Some methods available in the MLflow API might not be available when you're using Azure Machine Learning. For details about supported and unsupported operations, see Support matrix for querying runs and experiments. You can also learn about supported MLflow functionalities in Azure Machine Learning from the article MLflow and Azure Machine Learning.
Note
- To track experiments running on Azure Databricks, see Track Azure Databricks machine learning experiments with MLflow and Azure Machine Learning.
- To track experiments running on Azure Synapse Analytics, see Track Azure Synapse Analytics ML experiments with MLflow and Azure Machine Learning.
Prerequisites
Have an Azure subscription and the free or paid version of Azure Machine Learning.
To run Azure CLI and Python commands, install Azure CLI v2 and the Azure Machine Learning SDK v2 for Python. The
mlextension for Azure CLI installs automatically the first time you run an Azure Machine Learning CLI command.
Install the MLflow SDK
mlflowpackage and the Azure Machine Learningazureml-mlflowplugin for MLflow:pip install mlflow azureml-mlflowTip
You can use the
mlflow-skinnypackage, which is a lightweight MLflow package without SQL storage, server, UI, or data science dependencies. We recommend this package for users who primarily need the MLflow tracking and logging capabilities but not the full suite of features, including deployments.Create an Azure Machine Learning workspace. To create a workspace, see Create resources you need to get started. Review the access permissions you need to perform MLflow operations in your workspace.
To do remote tracking, or track experiments running outside Azure Machine Learning, configure MLflow to point to the tracking URI of your Azure Machine Learning workspace. For more information on how to connect MLflow to your workspace, see Configure MLflow for Azure Machine Learning.
Configure the experiment
MLflow organizes information in experiments and runs. Runs are called jobs in Azure Machine Learning. By default, runs log to an automatically created experiment named Default, but you can configure which experiment to track.
For interactive training, such as in a Jupyter notebook, use the MLflow command mlflow.set_experiment(). For example, the following code snippet configures an experiment:
experiment_name = 'hello-world-example'
mlflow.set_experiment(experiment_name)
Configure the run
Azure Machine Learning tracks training jobs in what MLflow calls runs. Use runs to capture all the processing that your job performs.
When you work interactively, MLflow starts tracking your training routine as soon as you log information that requires an active run. For instance, if MLflow's autologging functionality is enabled, MLflow tracking starts when you log a metric or parameter, or start a training cycle.
However, it's usually helpful to start the run explicitly, especially if you want to capture the total time for your experiment in the Duration field. To start the run explicitly, use mlflow.start_run().
Whether you start the run manually or not, you eventually need to stop the run, so that MLflow knows that your experiment run is done and can mark the run's status as Completed. To stop a run, use mlflow.end_run().
The following code starts a run manually and ends it at the end of the notebook:
mlflow.start_run()

# Your code

mlflow.end_run()
It's best to start runs manually so you don't forget to end them. You can use the context manager paradigm to help you remember to end the run.
with mlflow.start_run() as run:
    # Your code
When you start a new run by using mlflow.start_run(), it can be useful to specify the run_name parameter, which later translates to the name of the run in the Azure Machine Learning user interface. This practice helps you identify the run more quickly.
with mlflow.start_run(run_name="hello-world-example") as run:
    # Your code
Enable MLflow autologging
You can log metrics, parameters, and files with MLflow manually, and you can also rely on MLflow's automatic logging capability. Each machine learning framework supported by MLflow determines what to track automatically.
To enable automatic logging, insert the following code before your training code:
mlflow.autolog()
View metrics and artifacts in your workspace
The metrics and artifacts from MLflow logging are tracked in your workspace. You can view and access them in Azure Machine Learning studio or access them programmatically by using the MLflow SDK.
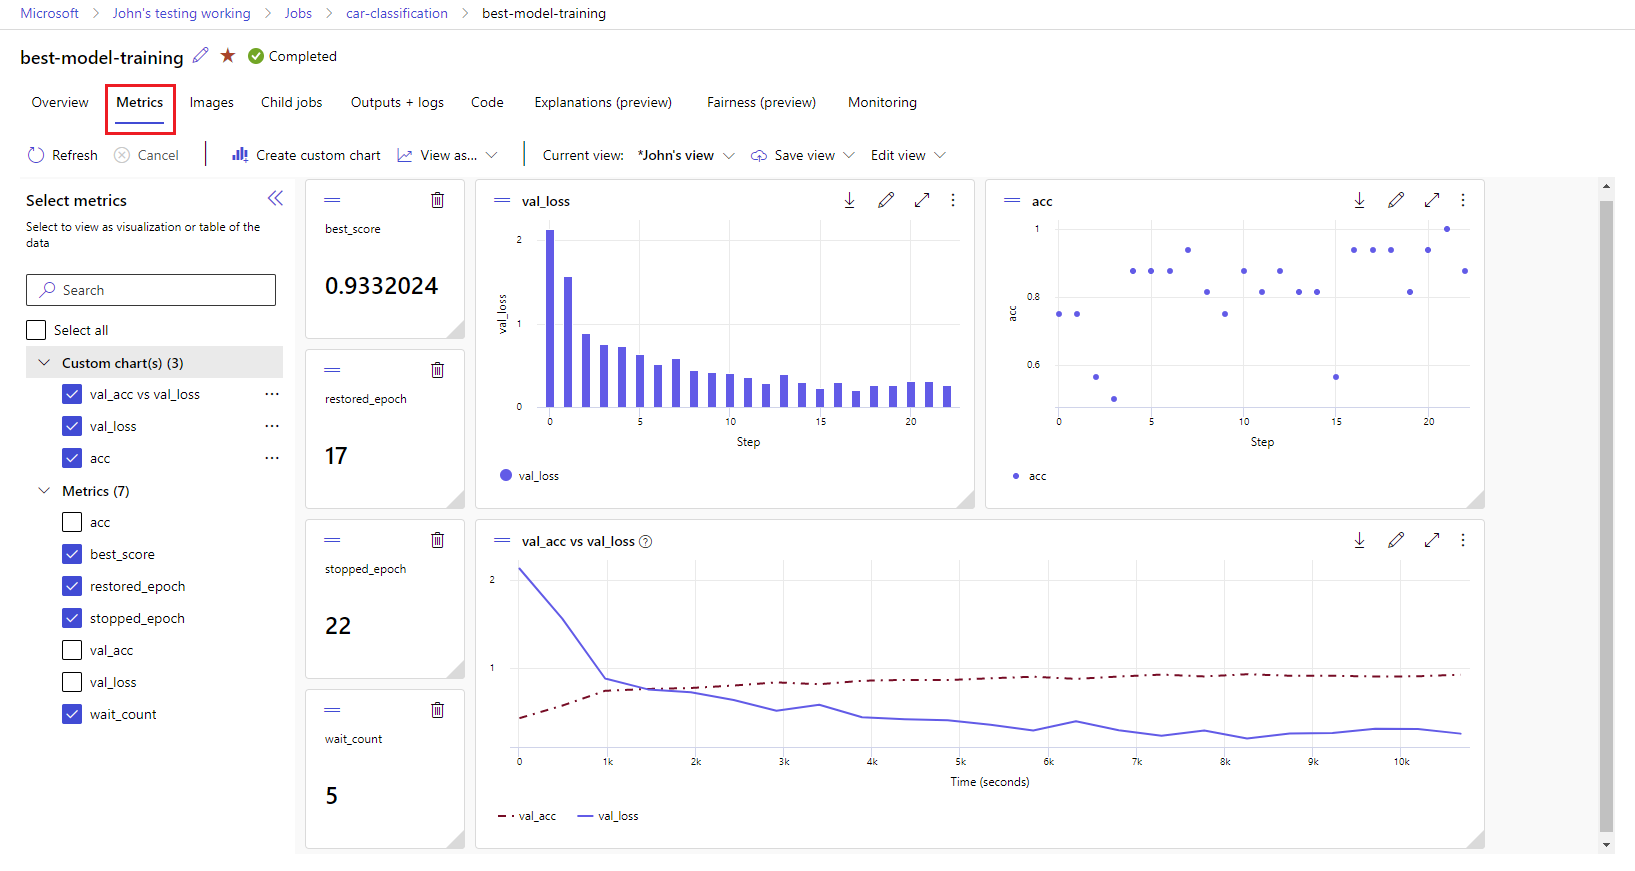
To view metrics and artifacts in the studio:
On the Jobs page in your workspace, select the experiment name.
On the experiment details page, select the Metrics tab.
Select logged metrics to render charts on the right side of the page. You can customize the charts by applying smoothing, changing the color, or plotting multiple metrics on a single graph. You can also resize and rearrange the layout.
After you create the view that you want, save it for future use and share it with your teammates by using a direct link.

To access or query metrics, parameters, and artifacts programmatically by using the MLflow SDK, use mlflow.get_run().
import mlflow

run = mlflow.get_run("<RUN_ID>")

metrics = run.data.metrics
params = run.data.params
tags = run.data.tags

print(metrics, params, tags)
Tip
The preceding example returns only the last value of a given metric. To retrieve all the values of a given metric, use the mlflow.get_metric_history method. For more information on retrieving metrics values, see Get params and metrics from a run.
To download artifacts you logged, such as files and models, use mlflow.artifacts.download_artifacts().
mlflow.artifacts.download_artifacts(run_id="<RUN_ID>", artifact_path="helloworld.txt")
For more information about how to retrieve or compare information from experiments and runs in Azure Machine Learning by using MLflow, see Query and compare experiments and runs with MLflow.