Note
Access to this page requires authorization. You can try signing in or changing directories.
Access to this page requires authorization. You can try changing directories.
Azure HDInsight is an enterprise-ready, managed-cluster service. This service runs open-source analytics frameworks like Apache Spark, Hadoop, HBase, and Kafka on Azure. Azure HDInsight integrated with other Azure services to enable customers to better manage their big data analytics applications.
Log Analytics provides a tool in the Azure portal to edit and run log queries. The queries come from data collected by Azure Monitor Logs and interactively analyze their results. Customers can use Log Analytics queries to retrieve records that match specific criteria. They can also use queries to identify trends, analyze patterns, and provide insights into their data.
Azure HDInsight enabled integration with Log Analytics in 2017. HDInsight customers quickly adopted this feature to monitor their HDInsight clusters and query the logs in the clusters. While adoption of this feature increased, customers provided feedback about the integration:
Customers can't decide which logs to store, and storing all the logs can become expensive.
Current HDInsight schemas logs don’t follow consistent naming conventions and some tables are repetitive.
Customers want an out-of-box dashboard to easily monitor the KPI of their HDInsight clusters.
Customers must jump to Log Analytics to run simple queries.
Solution overview
Considering customer feedback, the Azure HDInsight team invested in integration with Azure Monitor. This integration enables:
A new set of tables in customers' Log Analytics workspace. The new tables are delivered through a new Log Analytics pipeline.
Higher reliability.
Faster log delivery.
Resource-based table grouping and default queries.
Improved security with System Managed Identity for the Azure Monitor agent workspaces.
Automated DCR resource creation for the existing tables.
Note
Azure Monitor Agent (AMA) integration (including DCR and System Identity Authentication) is available in all regions, where HDInsight is available.
Benefits of Azure Monitor Agent (AMA) integration
This document outlines the changes to the Azure Monitor integration and provides best-practices for using the new tables.
Redesigned schemas: The schema formatting for the new Azure Monitor integration is better organized and easy to understand. There are two-thirds fewer schemas to remove as much ambiguity in the legacy schemas as possible.
Selective Logging: There are logs and metrics available through Log Analytics. To help you save on monitoring costs, we're releasing a new selective logging feature. Use this feature to turn on and off different logs and metric sources. With this feature, you need to pay for what you use. For more information, see Selective Logging.
Logs cluster portal integration: The Logs pane is new to the HDInsight Cluster portal. Anyone with access to the cluster can go to this pane to query any table that the cluster resource sends records to. Users don't need access to the Log Analytics workspace anymore to see the records for a specific cluster resource.
Insights cluster portal integration: The Insights pane is also new to the HDInsight Cluster portal. After enabling the new Azure Monitor integration, you can select the Insights pane and an out-of-box logs and metrics dashboard specific to the cluster's type will automatically populate for you. These dashboards revamped from our previous Azure solutions. They give you deep insights into your cluster's performance and health.
Customer scenarios
The following sections describe how customers can use the new Azure Monitor Agent integration in different scenarios.
The Activate a new Azure Monitor Agent integration section outlines how to activate and use the new Azure Monitor integration.
The Migrating from Azure Monitor Classic to the new Azure Monitor Agent Integration section includes additional information for users that depend on the older adults Azure Monitor integration.
Note
Customers using Azure Monitor Classic will no longer work after 31 August, 2024.
Customers using New Azure Monitor experience (preview) are required to migrate to Azure Monitor Agent (AMA) before January 31, 2025.
Clusters with image 2407260448 with the latest HDInsight API 2024-08-01-preview will have ability to enable the Azure Monitor Agent integration, and this will be the default setup for customers using image 2407260448.
Activate a new Azure Monitor Agent integration
Note
You must have a Log Analytics workspace created in a subscription you have access to before enabling the new azure monitor agent integration. In case you are migrating from Azure monitor experience to Azure Monitor Agent setup, you can reuse your Log analytics workspace from your existing cluster
You are expected to use the same Azure region for log analytics workspace, and HDInsight cluster for smoother migration.
If your workspace is in a different subscription, you must need to use PowerShell to enable Azure monitoring.
For more information about how to create a Log Analytics workspace, see Create a Log Analytics workspace in the Azure portal.
Approach 1: Enable Azure monitor agent using Portal
Activate the new integration by going to your cluster's portal page and scrolling down the menu on the left until you reach the Monitoring section.
In the Monitoring section, select Monitor integration.
Then, select Enable and you can choose the Log Analytics workspace that you want your logs to be sent to.
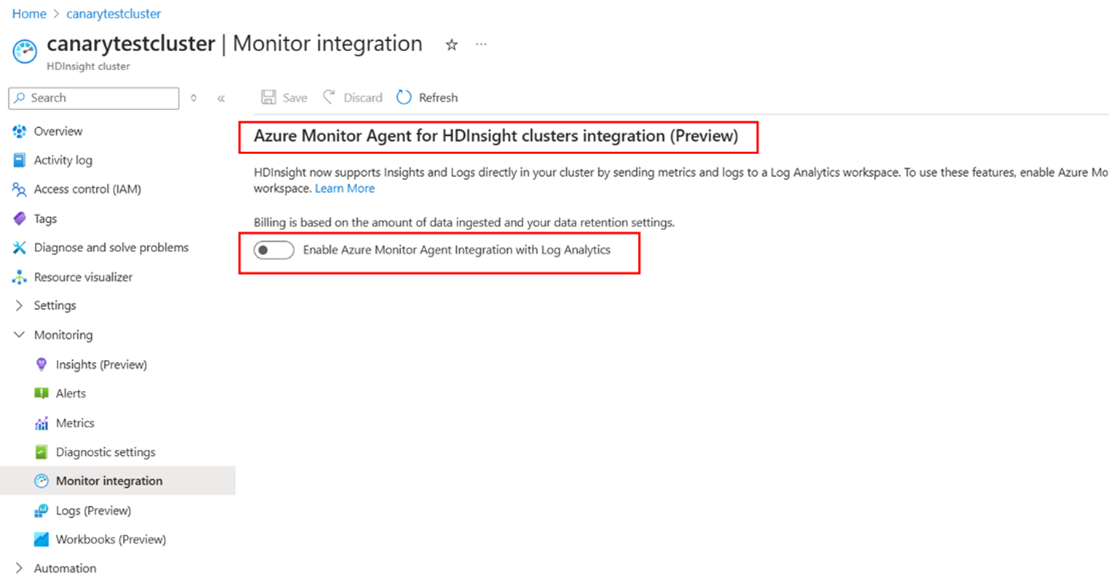
Enable Azure Monitor Agent Integration with Log Analytics and select your workspace (existing workspace when you're migrating from your previous image to newer image).
Once you confirm the workspace selection, precondition steps commence.
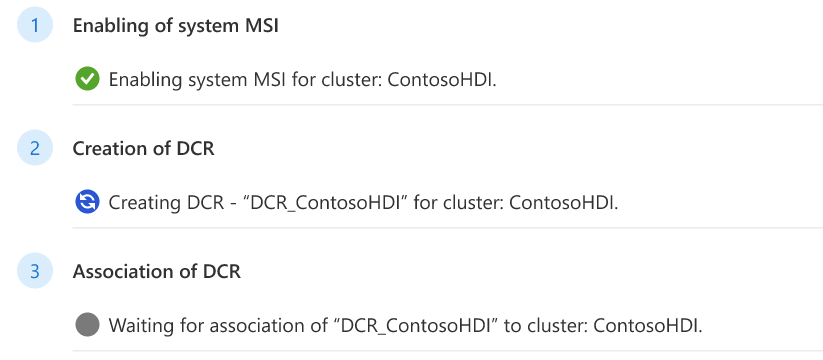
Select Save once precondition steps are complete.


Approach 2: Enable Azure monitor agent using Azure PowerShell
Enable system-assigned MSI
First get cluster information to check the MSI of cluster.
Get-AzHDInsightCluster -ResourceGroupName $resourceGroup –ClusterName $clusterIf this cluster has no MSI, directly enable system assigned MSI
Update-AzHDInsightCluster -ResourceGroupName $resourceGroup -ClusterName $cluster -IdentityType "SystemAssigned"If this cluster only has user assigned MSI, add system assigned MSI to identity.
Update-AzHDInsightCluster -ResourceGroupName $resourceGroup -ClusterName $cluster -IdentityType "SystemAssigned,UserAssigned" -IdentityId "$userAssignedIdentityResourceId"
If this cluster already system assigned MSI, no need to anything.
Creation of DCR
For more information, see Create and edit data collection rules (DCRs).
# The URL of the DCR template file, change {HDIClusterType} to your cluster type.

# The valid types are: hadoop, hbase, interactivehive, kafka, llap, spark

$dcrTemplatejsonUrl = "https://hdiconfigactions.blob.core.windows.net/azuremonitoriningagent/DCR/{HDIClusterType}_dcr_template.json"

$dcrJsonContent = Invoke-RestMethod -Uri $dcrTemplatejsonUrl


# Get details of your Log Analytics workspace, if your workspace is in another subscription, you need to change context to the subscription

$workspaceResourceGroupName = "{yourWorkspaceResourceGroup}"

$workspaceName = {yourWorkspaceName}

$workspace = Get-AzOperationalInsightsWorkspace -ResourceGroupName $workspaceResourceGroupName -Name $workspaceName


# Customize the DCR content

$dcrJsonContent.properties.destinations.logAnalytics[0].workspaceResourceId = $workspace.ResourceId

$dcrJsonContent.properties.destinations.logAnalytics[0].workspaceId = $workspace.CustomerId

$dcrJsonContent.location = $workspace.Location


# Create the DCR using the customized JSON (DCR needs to be in the same location as Log Analytics workspace).

# If your HDInsight cluster is in another subscription, you need to change context to your cluster’s subscription

$dcrName = " {yourDcrName} "

$resourceGroupName = " {YourDcrResourceGroup} "

$dcrStr = $dcrJsonContent | ConvertTo-Json -Depth 10

$dcr = New-AzDataCollectionRule -Name $dcrName -ResourceGroupName $resourceGroupName -JsonString $dcrStr
Association of DCR.
For more information, see Set up the Azure Monitor agent on Windows client devices.
# Associate DCR to HDInsight cluster

$hdinsightClusterResourceId = "/subscriptions/{subscription}/resourceGroups/{resourceGroup}/providers/Microsoft.HDInsight/clusters/{clusterName}"

$dcrAssociationName = "{yourDcrAssociation}"

New-AzDataCollectionRuleAssociation -AssociationName $dcrAssociationName -ResourceUri $hdinsightClusterResourceId -DataCollectionRuleId $dcr.Id
Enabling Azure Monitor Agent.
# Enter user information

$resourceGroup = "<your-resource-group>"

$cluster = "<your-cluster>"

$LAW = "<your-Log-Analytics-workspace>"

# End of user input


# obtain workspace id for defined Log Analytics workspace

$WorkspaceId = (Get-AzOperationalInsightsWorkspace -ResourceGroupName $resourceGroup -Name $LAW).CustomerId


# obtain primary key for defined Log Analytics workspace

$PrimaryKey = (Get-AzOperationalInsightsWorkspace -ResourceGroupName $resourceGroup -Name $LAW | Get-AzOperationalInsightsWorkspaceSharedKeys).PrimarySharedKey


# Enables monitoring and relevant logs will be sent to the specified workspace.

Enable-AzHDInsightAzureMonitorAgent -ResourceGroupName $resourceGroup -ClusterName $cluster -WorkspaceId $WorkspaceId -PrimaryKey $PrimaryKey


# Gets the status of monitoring installation on the cluster.

Get-AzHDInsightAzureMonitorAgent -ResourceGroupName $resourceGroup -ClusterName $cluster
(Optional) disabling Azure Monitor Agent.
Disable-AzHDInsightAzureMonitorAgent -ResourceGroupName $resourceGroup -ClusterName $cluster
Approach 3: Enable Azure monitor agent using Azure CLI
Enable system-assigned MSI.
First get cluster information to check the MSI of cluster.
az hdinsight show –-resource-group $resourceGroup –name $cluster

#get access token if needed

accessToken=$(az account get-access-token --query accessToken -o tsv)

url="https://management.azure.com/subscriptions/${subscriptionId}/resourcegroups/${resourceGroupName}/providers/Microsoft.HDInsight/clusters/${clusterName}?api-version=2024-08-01-preview"
If this cluster has no MSI, directly enable system assigned MSI via rest API.
 body="{\"identity\": {\"type\": \"SystemAssigned\"}}"

 az rest --method patch --url "$url" --body "$body" --headers "Authorization=Bearer $accessToken"
If this cluster only has user assigned MSI, add system assigned MSI to identity.
body="{\"identity\": {\"type\": \"SystemAssigned,UserAssigned\", \"userAssignedIdentities\": {$userAssignedIdentityResourceId:{}}}}"

az rest --method patch --url "$url" --body "$body" --headers "Authorization=Bearer $accessToken"
If this cluster already system assigned MSI, no need to anything.
Creation of DCR.
For more information, see Create and edit data collection rules (DCRs)
# The URL of the DCR template file, change {HDIClusterType} to your cluster type.

# The valid types are: hadoop, hbase, interactivehive, kafka, llap, spark

$dcrTemplatejsonUrl = "https://hdiconfigactions.blob.core.windows.net/azuremonitoriningagent/DCR/{HDIClusterType}_dcr_template.json?api-version=2020-08-01"


# Download dcr template to local

$dcrTemplateLocalFile = "dcrTemplateFileName.json"

azcopy copy $dcrTemplatejsonUrl $dcrTemplateLocalFile


# Set subscription

az account set --subscription "{yourSubscription}"


# Get details of your Log Analytics workspace

$workspaceResourceGroupName = "{yourWorkspaceResourceGroup}"

$workspaceName = "{yourWorkspaceName}"

$workspace = az monitor log-analytics workspace show --resource-group $workspaceResourceGroupName --workspace-name $workspaceName


# Customize the DCR content. Below script depends on jq, you need to install it if it’s not available in your environment.

$workspaceResourceId = $workspace | jq -r '.id'

$workspaceId = $workspace | jq -r '.customerId'

$location = $workspace | jq -r '.location'


# Read the JSON file

$templateJsonData=cat $dcrTemplateLocalFile


# Update the JSON fields using jq

$templateJsonData=echo $templateJsonData | jq --arg workspaceResourceId $workspaceResourceId '.properties.destinations.logAnalytics[0].workspaceResourceId = $workspaceResourceId'

$templateJsonData=echo $templateJsonData | jq --arg workspaceId $workspaceId '.properties.destinations.logAnalytics[0].workspaceId = $workspaceId'

$templateJsonData=echo $templateJsonData | jq --arg location $location '.location = $location'


# Save the updated JSON back to the file

echo $templateJsonData > $dcrTemplateLocalFile


# Print the updated JSON

cat $dcrTemplateLocalFile


# Create the DCR using the customized JSON (DCR needs to be in the same location as Log Analytics workspace)

# If your HDInsight cluster is in another subscription, you need to set subscription to your cluster’s subscription

$dcrName = "{yourDcrName}"

$resourceGroupName = "{YourDcrResourceGroup}" # Suggest to put DCR in the same resource group as your HDInsight cluster

$dcr = az monitor data-collection rule create --name $dcrName --location $location --resource-group $resourceGroupName --rule-file $dcrTemplateLocalFile
Association of DCR
# Associate DCR to HDInsight cluster

$hdinsightClusterResourceId = "{YourHDInsightClusterResourceId}"

$dcrAssociationName = "{yourDcrAssociation}"

$dcrId = $dcr | jq -r '.id'

az monitor data-collection rule association create --association-name $dcrAssociationName --resource $hdinsightClusterResourceId --data-collection-rule-id $dcrId
Enabling Azure Monitor Agent
# set variables

export resourceGroup=RESOURCEGROUPNAME

export cluster=CLUSTERNAME

export LAW=LOGANALYTICSWORKSPACENAME


# Enable the Azure Monitor Agent logs integration on an HDInsight cluster.

az hdinsight azure-monitor-agent enable --name $cluster --resource-group $resourceGroup --workspace $LAW


# Get the status of Azure Monitor Agent logs integration on an HDInsight cluster.

az hdinsight azure-monitor-agent show --name $cluster --resource-group $resourceGroup
(Optional) disabling Azure Monitor Agent.
az hdinsight azure-monitor-agent disable --name $cluster --resource-group $resourceGroup
Enable Azure Monitor Agent logging for Spark cluster
Azure HDInsight Spark clusters control AMA integration using a Spark configuration spark.hdi.ama.enabled, by default the value is set to false. This configuration controls whether the Spark specific logs will come up in the Log Analytics workspace. If you want to enable AMA in your Spark clusters and retrieve the Spark event logs in their LA workspaces, you need to perform an additional step to enable AMA for spark specific logs.
The following steps describe how customers can enable the new Azure Monitor Agent logging for their spark workloads.
Go to Ambari -> Spark Configs.
Navigate to Custom Spark defaults and search for config
spark.hdi.ama.enabled, the default value of this config will be false. Set this value as true.
Click save and restart Spark services on all nodes.
Access the tables in LA workspace.

Access the new tables
There are two ways you can access the new tables.
Approach 1
The first way to access the new tables is through the Log Analytics workspace.
Go to the Log Analytics workspace that you selected when you enabled the integration.
Scroll down in the menu on the left side of the screen and select Logs. A Logs query editor pops up with a list of all the tables in the workspace.
If the tables grouped by Solution, the new HDInsight tables are under the Logs Management section.
If you group the tables by Resource Type, the tables are under the HDInsight Clusters section as shown in the image.
Note
This process describes how the logs were accessed in the old integration. This requires the user to have access to the workspace.
Approach 2
The second way to access the new tables is through Cluster portal access.
Navigate to your Cluster's portal page and scroll down the menu on the left side until you see the Monitoring section. In this section, you'll see the Logs pane.
Select Logs and a Logs query editor appears. The editor contains all logs that are associated with the cluster resource. You sent the logs to the Log Analytics workspace when you enabled integration. These logs provide resource-based access (RBAC). With RBAC, users who have access to the cluster but not to the workspace can see the logs that are associated with the cluster.
For comparison, the following screenshots show the legacy integration workspace view and the new integration workspace view:
Legacy (Azure Monitor Classic) integration workspace view

New (Azure monitor experience / Azure Monitor Agent) integration workspace view

Use the new tables
Default queries to use with new tables
In your Logs query editor, set the toggle to Queries above the tables list. Make sure that you group the queries by Resource Type and that there's no filter set for a resource type other than HDInsight Clusters. The following image shows how the results look when grouped by Resource Type and filtered for HDInsight Clusters. Just select one and it appears in the Logs query editor. Be sure to read the comments included in the queries, as some require you to enter some information, like your cluster name, for the query to run successfully.
Create your own queries
You can enter your own queries in the Logs query editor. Queries used on the old tables won't be valid on the new tables as many of the new tables have new, refined schemas. The default queries are great references for shaping queries on the new tables.
Insights
Insights are cluster-specific visualization dashboards made using Azure Workbooks. These dashboards give you detailed graphs and visualizations of how your cluster is running. The dashboards have sections for each cluster type, YARN, system metrics, and component logs. You can access your cluster's dashboard by visiting your cluster's page in the portal, scrolling down to the Monitoring section, and selecting the Insights pane. The dashboard loads automatically if enabled the new integration. Allow a few seconds for the graphs to load as they query the logs.

Custom Azure workbooks
You can create your own Azure workbooks with custom graphs and visualizations. In your cluster's portal page, scroll down to the Monitoring section and select the Workbooks pane in the menu on the left. You can either start using a blank template or use one of the templates under the HDInsight Clusters section. There's a template for each cluster type. Templates are useful if you want to save specific customizations that the default HDInsight Insights don't provide. Feel free to send in requests for new features in the HDInsight Insights if you feel they're lacking something.
Alerts
You can add custom alerts to your clusters and workspaces in the Log query editor. Go to the Logs query editor by selecting the Logs pane from either your cluster or workspace portal. Run a query and then select New Alert Rule as shown in the following screenshot. For more information, read about configuring alerts.

Migrate to the new Azure Monitor Agent Integration
If you're using the classic Azure Monitor integration, you need to make some adjustments to the new table formats after you switch to the new Azure Monitor integration.
To enable the new Azure Monitor integration, follow the steps outlined in the Activate a new Azure Monitor Agent integration section.
Run queries in Log Analytics
Since the new table format is different from the previous one, your queries need to be reworked so you can use our new tables. Once you enable the new Azure Monitor integration, you can browse the tables and schemas to identify the fields that are used in your old queries.
We provide a mapping table between the old table to the new table to help you quickly find the new fields you need to use to migrate your dashboards and queries.
Default queries: We created default queries that show how to use the new tables for common situations. The default queries also show what information is available in each table. You can access the default queries by following the instructions in the Default queries to use with new tables section in this article.
Update dashboards for HDInsight clusters
If you build multiple dashboards to monitor your HDInsight clusters, you need to adjust the query behind the table once you enable the new Azure Monitor integration. The table name or the field name might change in the new integration, but all the information you have in old integration is included.
Refer to the mapping table between the old table/schema to the new table/schema to update the query behind the dashboards
Out-of-box dashboards
We also improved the out-of-box dashboards both at the cluster-level. There's a button on the top right of every graph that allows you to see the underlying query that produces the information. The graph is a great way to familiarize yourself with how the new tables can be queried effectively.
Release and support timeline
Classic Azure Monitoring integration isn't available after October 15, 2021. You can't enable classic Azure Monitoring integration after that date.
Classic Azure Monitoring integration ingestion will not be working after August 31, 2024.
HDInsight clusters with Azure Monitor integration (preview) will not be supported beyond February 1, 2025.
Existing Azure Monitor integration(preview) will continue to work, until January 31, 2025. There will be limited support for the Azure Monitor integration(preview).
If solution requires image change, customers should move to the new integration.
Microsoft will not patch the Azure Monitor integration (preview) clusters except for critical security issues.
HDInsightGatewayAuditLogs_CLtable will no longer be functional from September 14, 2026, as The Azure Monitor HTTP Data Collector API is being deprecated.
Appendix: Table mapping
For the log table mappings from the classic Azure Monitor integration to the new one, see Log table mapping.