Note
Access to this page requires authorization. You can try signing in or changing directories.
Access to this page requires authorization. You can try changing directories.
Azure DevOps Services | Azure DevOps Server 2022 | Azure DevOps Server 2020
This article shows you how to establish a seamless connection between Power BI and Azure DevOps by using Power BI Data Connector. You can use this integration to extract valuable insights from your Azure DevOps data and create compelling reports within Power BI. Power BI Data Connector uses Analytics views.
Important
Analytics views only support Azure Boards data (work items). Analytics views don't support other data types, such as pipelines. Views provide a flat list of work items and don't support work item hierarchies. At this point, there are no plans to update the connector to support other types of data. For information on other approaches, see About Power BI integration.
Prerequisites
| Category | Requirements |
|---|---|
| Access levels | - Project member - At least Basic access |
| Permissions | Analytics permissions. If you're a member of the Contributors group for the project, you have permission. |
| Tools | - Azure Boards enabled - Power BI Desktop |
| Tasks | - Familiarity with What is Analytics and the knowledge base of Power BI articles - An Analytics view to use in a Power BI report |
| Category | Requirements |
|---|---|
| Access levels | - Project member - At least Basic access |
| Permissions | Analytics permissions. If you're a member of the Contributors group for the project, you have permission. |
| Tools | - Analytics installed and enabled. Account owners or members of the Project Collection Administrators group can add extensions or enable the service. - Azure Boards enabled. - Power BI Desktop. |
| Tasks | - Familiarity with What is Analytics and the knowledge base of Power BI articles - An Analytics view to use in a Power BI report |
Important
Azure DevOps doesn't support Alternate Credentials authentication. If you're still using Alternate Credentials, we strongly encourage you to switch to a more secure authentication method.
Connect to an Analytics view
Follow these steps to connect to an Analytics view:
Open Power BI Desktop.
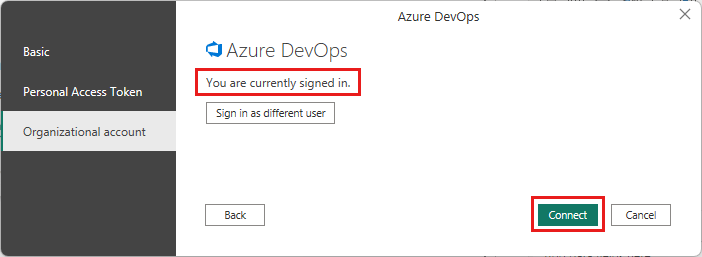
Sign in to the service. First-time access requires you to sign in and authenticate your credentials. Power BI Desktop saves your credentials, so you only have to sign in once.
Note
Azure DevOps doesn't support cross-tenant scenarios that use Open Authorization (OAuth). Instead, use service principals and managed identities.
Select Connect.
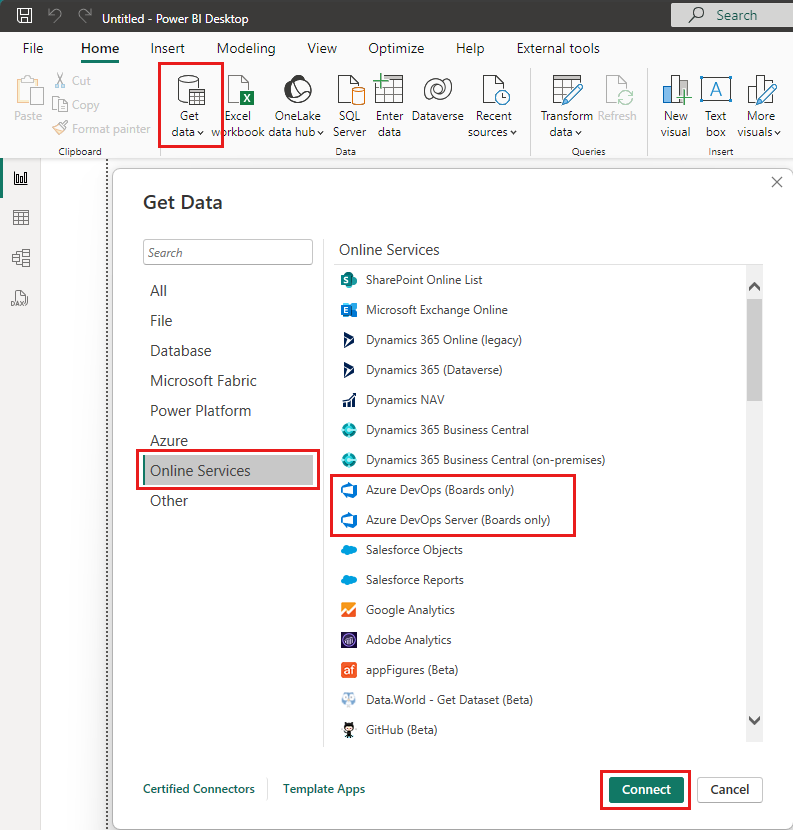
Select Get Data > Online Services, and then select Azure DevOps (Boards only) for cloud services or Azure DevOps Server (Boards only) for an on-premises server. Select Connect. Analytics views support queries only against work items and test cases.
Specify the basic parameters to connect to your data.

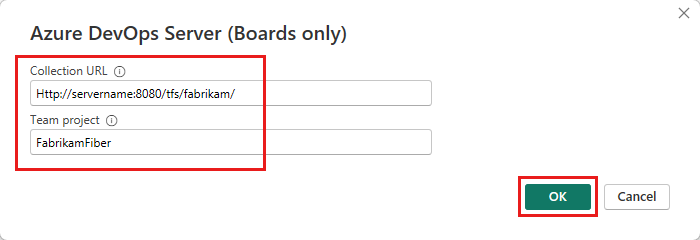
- Collection URL: Enter the URL where your Azure DevOps Server instance is hosted. An example URL is
https://fabrikam-server/AzureDevOpsServer/fabrikam-collection. - Team project: Enter only the project name. For example, enter Fabrikam-Fiber if the URL of your Azure DevOps Server instance is
https://fabrikam-server/AzureDevOpsServer/fabrikam-collection/Fabrikam-Fiber.
Important
Don't confuse the team name with the project name, which is a common mistake. For example, if the URL you use is
https://fabrikam-server/AzureDevOpsServer/fabrikam-collection/Fabrikam-Fiber-Git/Device, Fabrikam-Fiber-Git is the project name, and Device is the team name.After you successfully sign in, Power BI verifies that your credentials have the permissions that are needed to access the specified project. If any errors arise, see the FAQs for solutions to common problems.
- Collection URL: Enter the URL where your Azure DevOps Server instance is hosted. An example URL is
Select the Analytics view
Follow these steps to select the Analytics view:
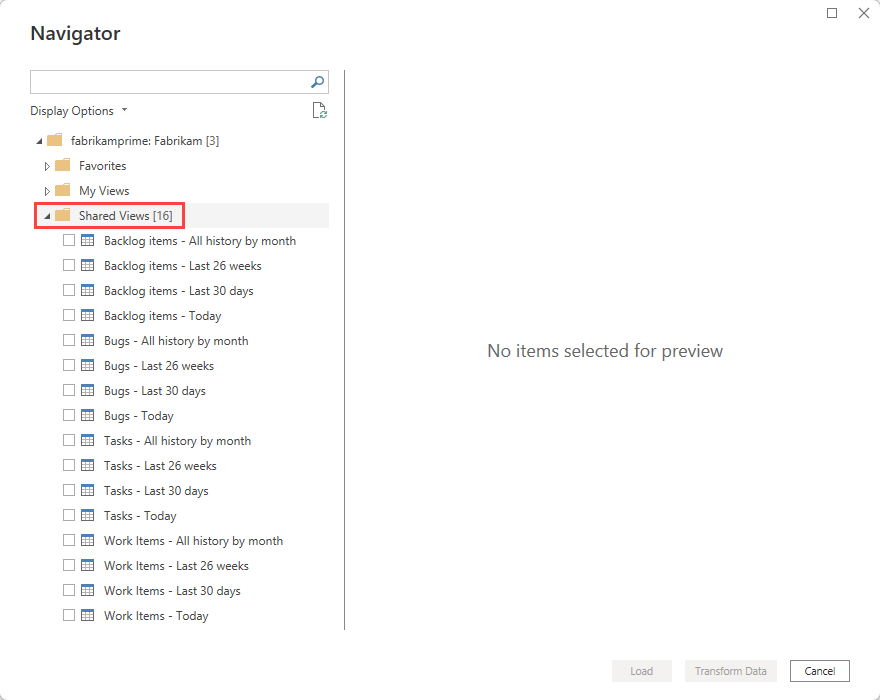
Expand Shared Views. The Data Connector presents a list of available Analytics views. Each view represents a set of data that you can pull into Power BI. You can also create custom Analytics views.
The following image shows the default Analytics views. Your list of views might differ based on the process model used to create your project. All views listed, except the views appended with Today, provide historical trend data.
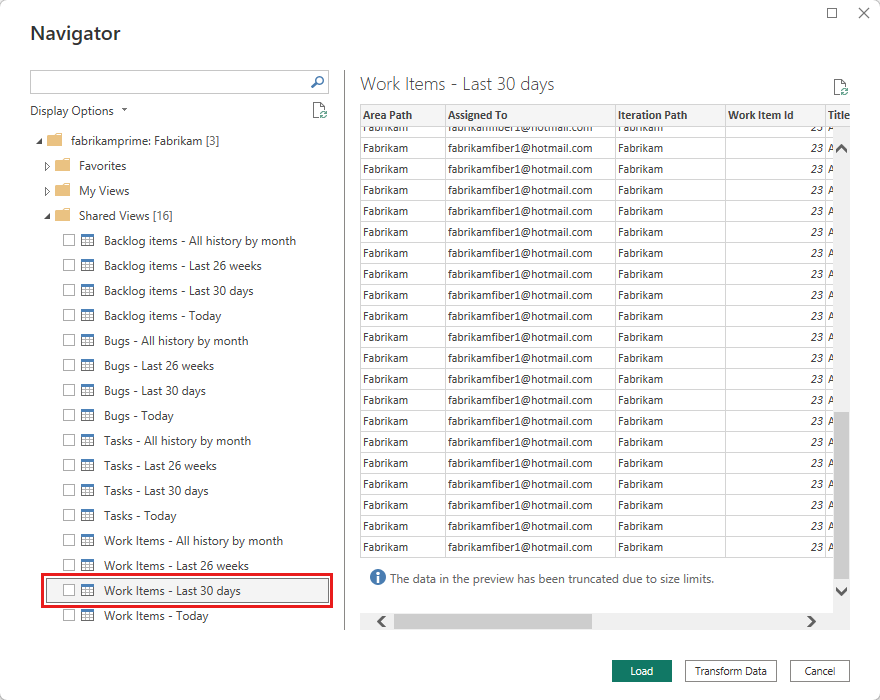
Select the Work Items - Last 30 days view and wait for the preview to load. This view uses a filter to show the last 30 days of history for all work items in the project.
Note
If you verify the view when you create it, the view should load. If the view doesn't load, it's most likely because the dataset is too large. Return to the Analytics views page in the web portal and open the view for editing. Adjust the filters to decrease the size of the dataset.
Note
- The preview shown for any selected view in the navigator can be truncated depending on the number of fields selected and the size of the dataset. The data gets truncated only for the preview and doesn't affect the full data refresh.
- Analytics views don't apply filters defined by using Power BI on the server. Any filters applied in Power BI limit the data shown to end users but don't reduce the amount of data retrieved from Analytics. If the filter is intended to reduce the size of the dataset, apply it by customizing the view.
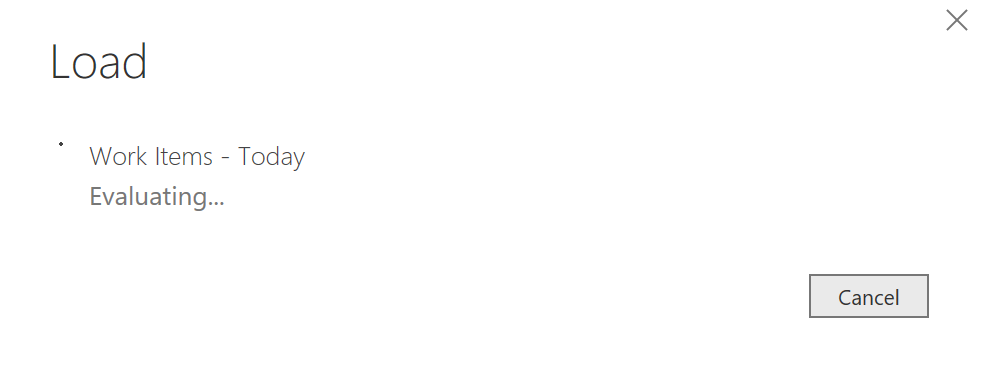
Select the Work Items - Today view, which represents the current state of all work items in the project. Select the checkbox next to the view, and then select Load. Wait for the data to load. Monitor its progress through the status messages displayed under the table name. If any errors occur, refer to the FAQs section for solutions to common issues.
Review the data model. While the model loads, review the dataset design for the Power BI Data Connector.
Create a report
After the load operation finishes, you can explore the data and create custom reports. For examples of common reports, see Example reports based on Analytics views.

FAQs
In this section, you can find answers to common questions about Power BI Data Connector and Analytics error messages.
Q: How should I read error messages coming from the connector?
A: You might feel challenged reading error messages coming from the connector because they typically contain extra contextual information. If the load operation fails, the message starts with "Failed to save modifications to the server." If you see this message, search for [DataSource.Error] within the text of the message to find the reason for the error and suggested steps.
The following example shows an error message returned from the connector. The most important parts are the statements about the query result exceeding the maximum size and the suggestion to reduce the number of records by applying more filters.
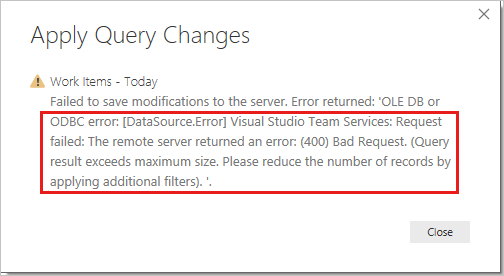
Q: How do I resolve the "Query result exceeds maximum size. Please reduce the number of records by applying additional filters" error?
A: You get the following error if the number of records retrieved from Analytics exceeds 250,000:
"Failed to save modifications to the server. Error returned: 'OLE DB or ODBC error: [DataSource.Error] Visual Studio Team Services: Request failed: The remote server returned an error: (400) Bad Request. (Query result exceeds maximum size. Please reduce the number of records by applying additional filters).'"
This error typically occurs when your project has a large number of work items. Reduce the size of the dataset by customizing the view. Do this step before you use the view in Power BI.
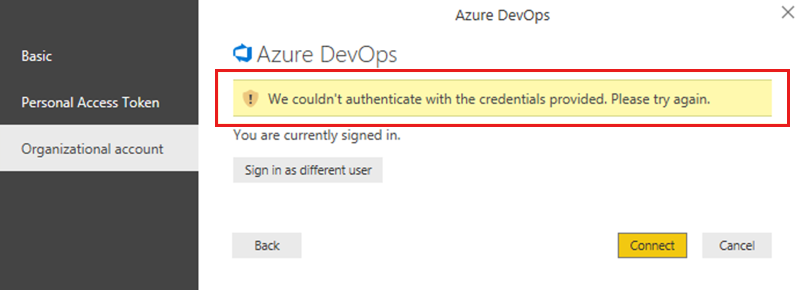
Q: How do I resolve an error about the user not being authorized?
A: You might get this error if you try to access a project that you don't have permissions for. You might also see it if Power BI doesn't recognize your credentials. To check your permissions, see Set permissions to access Analytics and Analytics views. If the issue involves credentials, work with your administrator to resolve the problem. For more information, see Power BI security, user authentication and Resolve sign-in issues for Power BI.
Note
Power BI uses Microsoft Entra ID to authenticate users who sign in to the Power BI service. In turn, Power BI uses the Power BI sign-in credentials whenever a user attempts to access resources that require authentication. Users sign in to the Power BI service by using the email address used to establish their Power BI account. Power BI uses that sign-in email as the effective username, which is passed to resources whenever a user attempts to connect to data. The effective username is then mapped to a user principal name and resolved to the associated Windows domain account, against which authentication is applied.
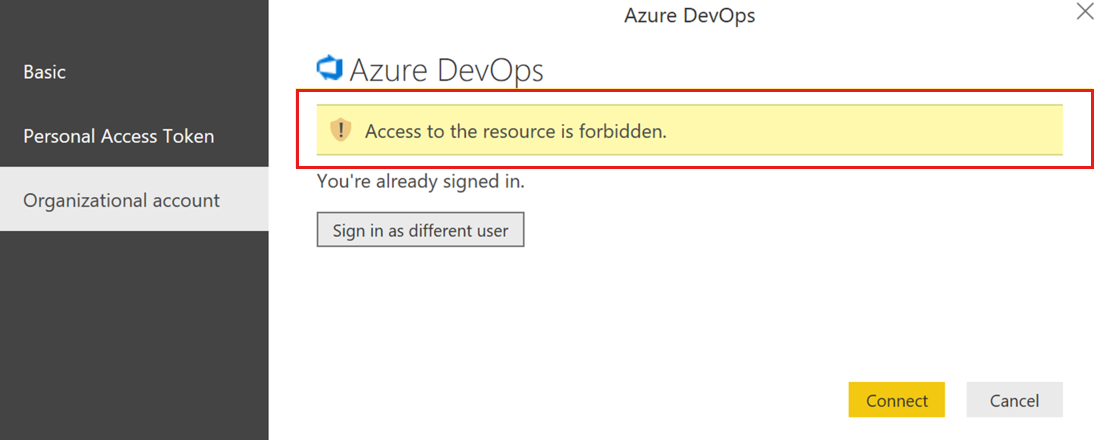
Q: How do I resolve the "Access to the resource is forbidden" error?
A: You might get this error if you have access to a specific project but you don't have the View analytics permission. Work with your project administrator to get this permission. For more information about the security model, see Set permissions to access Analytics and Analytics views.
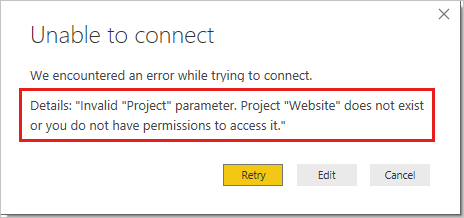
Q: How do I resolve the "Project 'X' does not exist or you do not have permissions to access it" error?
A: This error indicates that the value you entered for the project doesn't correspond to any project. A common mistake that users make is to confuse the project name with a team name.
For example, if the URL you use is https://dev.azure.com/fabrikam-fiber-inc/Fabrikam-Fiber-Git/Device, the project name is Fabrikam-Fiber-Git. You should enter this value as the project parameter to use for connecting to your data. Device is the team name.