Note
Access to this page requires authorization. You can try signing in or changing directories.
Access to this page requires authorization. You can try changing directories.
Overview
Microsoft Defender for Cloud Command‑Line Interface (Defender CLI) lets you embed security scanning directly in your continuous integration and continuous deployment (CI/CD) workflows. The CLI orchestrates several industry‑standard scanners and automatically correlates detected issues with resources monitored by Microsoft Defender for Cloud.
Note
Currently only results from the Trivy container‑vulnerability scanner are uploaded to Microsoft Defender for Cloud. Scan results from every other scanner still run and appear in the build logs/SARIF files, but they are not sent to the Defender for Cloud backend.
Key capabilities
- Container‑image vulnerability assessment with Trivy and automatic ingestion into Cloud Security Explorer.
- In‑pipeline source‑code checks such as SAST, secret‑detection, dependency analysis and IaC scanning.
- Unified, cross‑platform CLI that works with any CI runner (Azure Pipelines, GitHub Actions, Jenkins, Bitbucket, GitLab, CircleCI, Travis CI, AWS CodeBuild and more).
- Standards‑based SARIF output that integrates with pull‑request annotations and quality gates.
- Token‑based authentication scoped to a single Azure subscription for granular control.
Prerequisites
An Azure Subscription with Defender for Cloud onboarded. If you don't already have an Azure account, create one for free.
One of the following CI/CD pipeline tools: Jenkins, BitBucket Pipelines, Google Cloud Build, Bamboo, CircleCI, Travis CI, TeamCity, Oracle DevOps services, AWS CodeBuild
The Defender CSPM enabled.
Security Admin Permission to create the client ID and secret.
Setup
In the following sections, we explain how to retrieve the Client ID and Secrets, update the CI/CD pipeline script, and add environment variables to the CI/CD pipeline.
Retrieve the API Token
To allow security results from the Defender for Cloud CLI to be passed to the Defender for Cloud backend, the Security Admin in Microsoft Defender for Cloud must first generate an API key from Defender for Cloud for authentication.
Sign in to the Azure portaland open Microsoft Defender for Cloud.
Navigate to Management ▸ Environment settings ▸ Integrations.
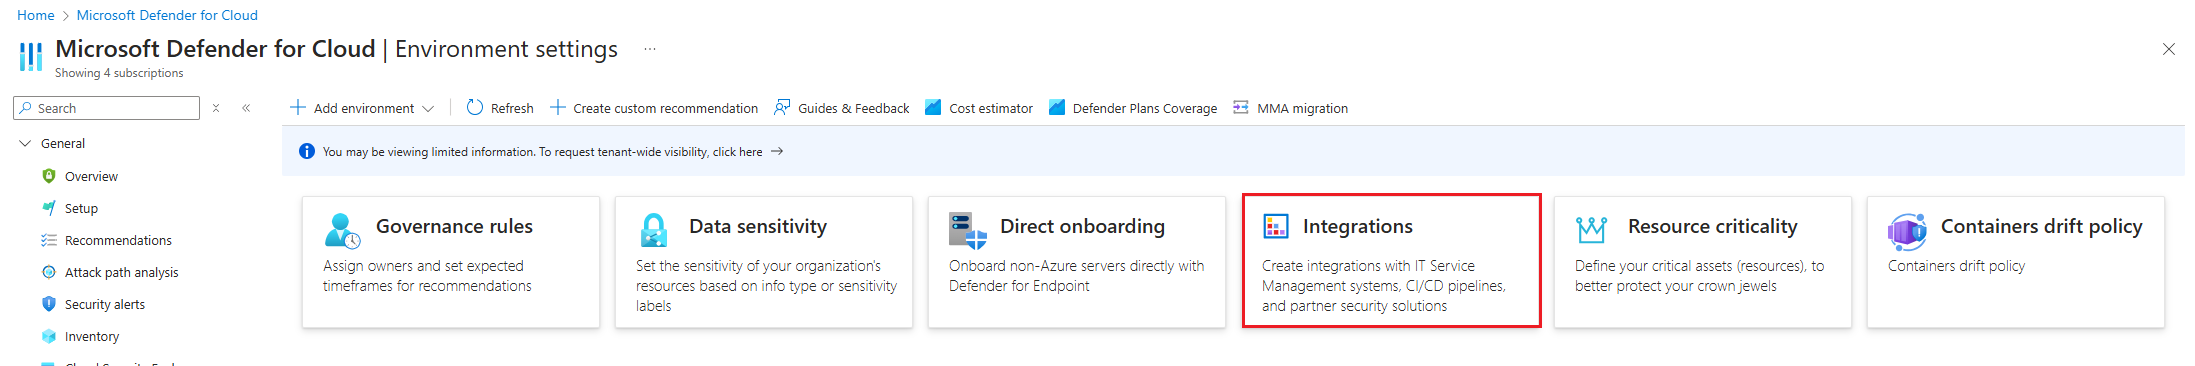
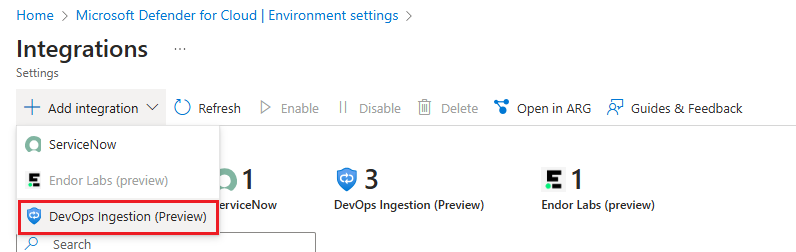
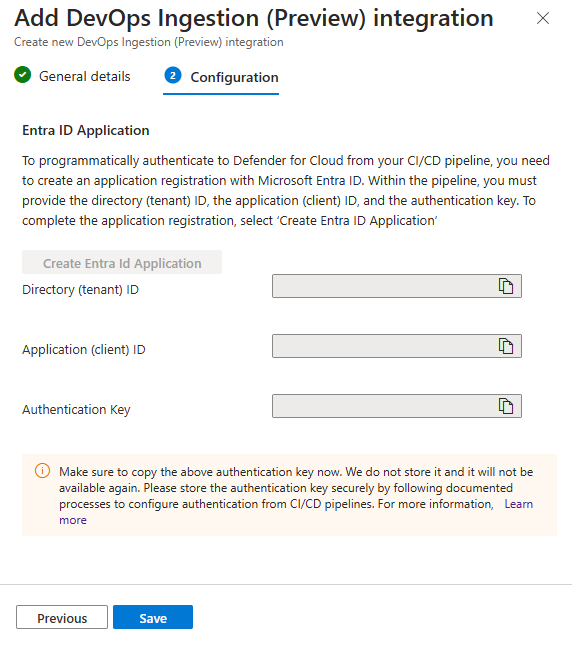
Select + Add integration ▸ DevOps Ingestion (Preview)
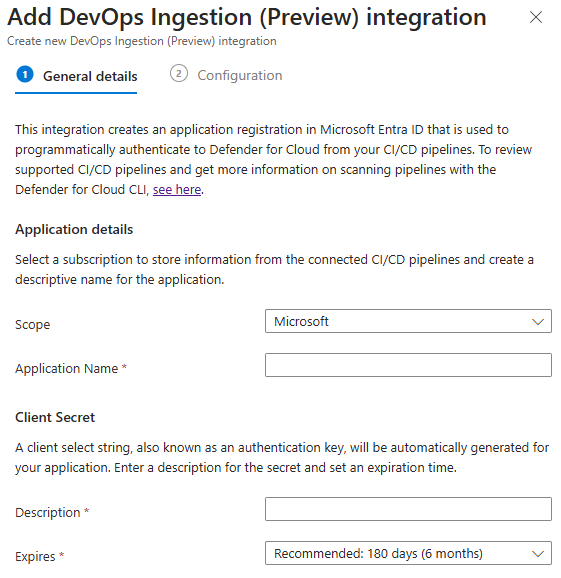
Enter an application name.
- Choose the tenant to store the secret.
- Set an expiration date, and enable the token.
- Select Save.
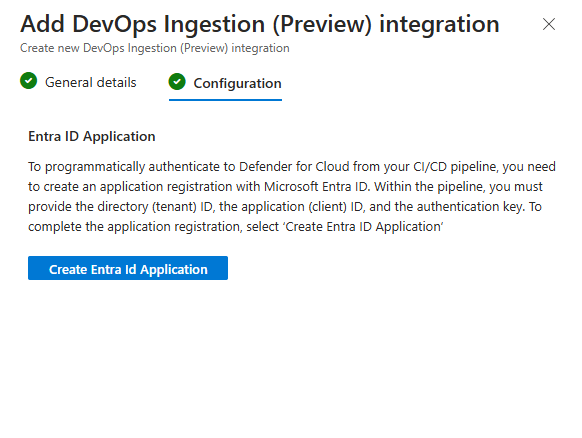
After Saving, copy the Client ID, Client Secret, and Tenant ID. You won’t be able to retrieve them again.


Pipeline variables
After securely receiving the tokens, configure an environment variable for the key. The environment variable is passed to the CLI through a shell script, which can be obtained using curl or by manually copying it into the repository.
| Variable | Description |
|---|---|
| GDN_MDC_CLI_CLIENT_ID | Client ID generated above |
| GDN_MDC_CLI_CLIENT_SECRET | Client Secret generated above |
| GDN_MDC_CLI_TENANT_ID | Azure AD Tenant ID |
| GDN_PIPELINENAME | bitbucket, jenkins, gcp, bamboo, circle, travis, teamcity, oci, or aws |
| GDN_TRIVY_ACTION | image |
| GDN_TRIVY_TARGET | Name of image being scanned |
Update the CI/CD pipeline script
Below is a minimal Bitbucket Pipeline example that downloads the latest cross‑platform build, initializes the project and runs Trivy. Other examples of CI/CD pipelines can be found in this GitHub Repository.
image: atlassian/default-image:3

pipelines:
  default:
    - parallel:
      - step:
          name: 'Defender CLI Trivy Scan'
          script:
            - curl -L -o ./msdo_linux.zip https://www.nuget.org/api/v2/package/Microsoft.Security.DevOps.Cli.linux-x64/
            - unzip ./msdo_linux.zip
            - chmod +x tools/guardian
            - chmod +x tools/Microsoft.Guardian.Cli
            - tools/guardian init --force
            - tools/guardian run -t trivy --export-file ./ubuntu-test.sarif --publish-file-folder-path ./ubuntu-test.sarif
Review results in Cloud Security Explorer
After the pipeline runs successfully, navigate to Microsoft Defender for Cloud.
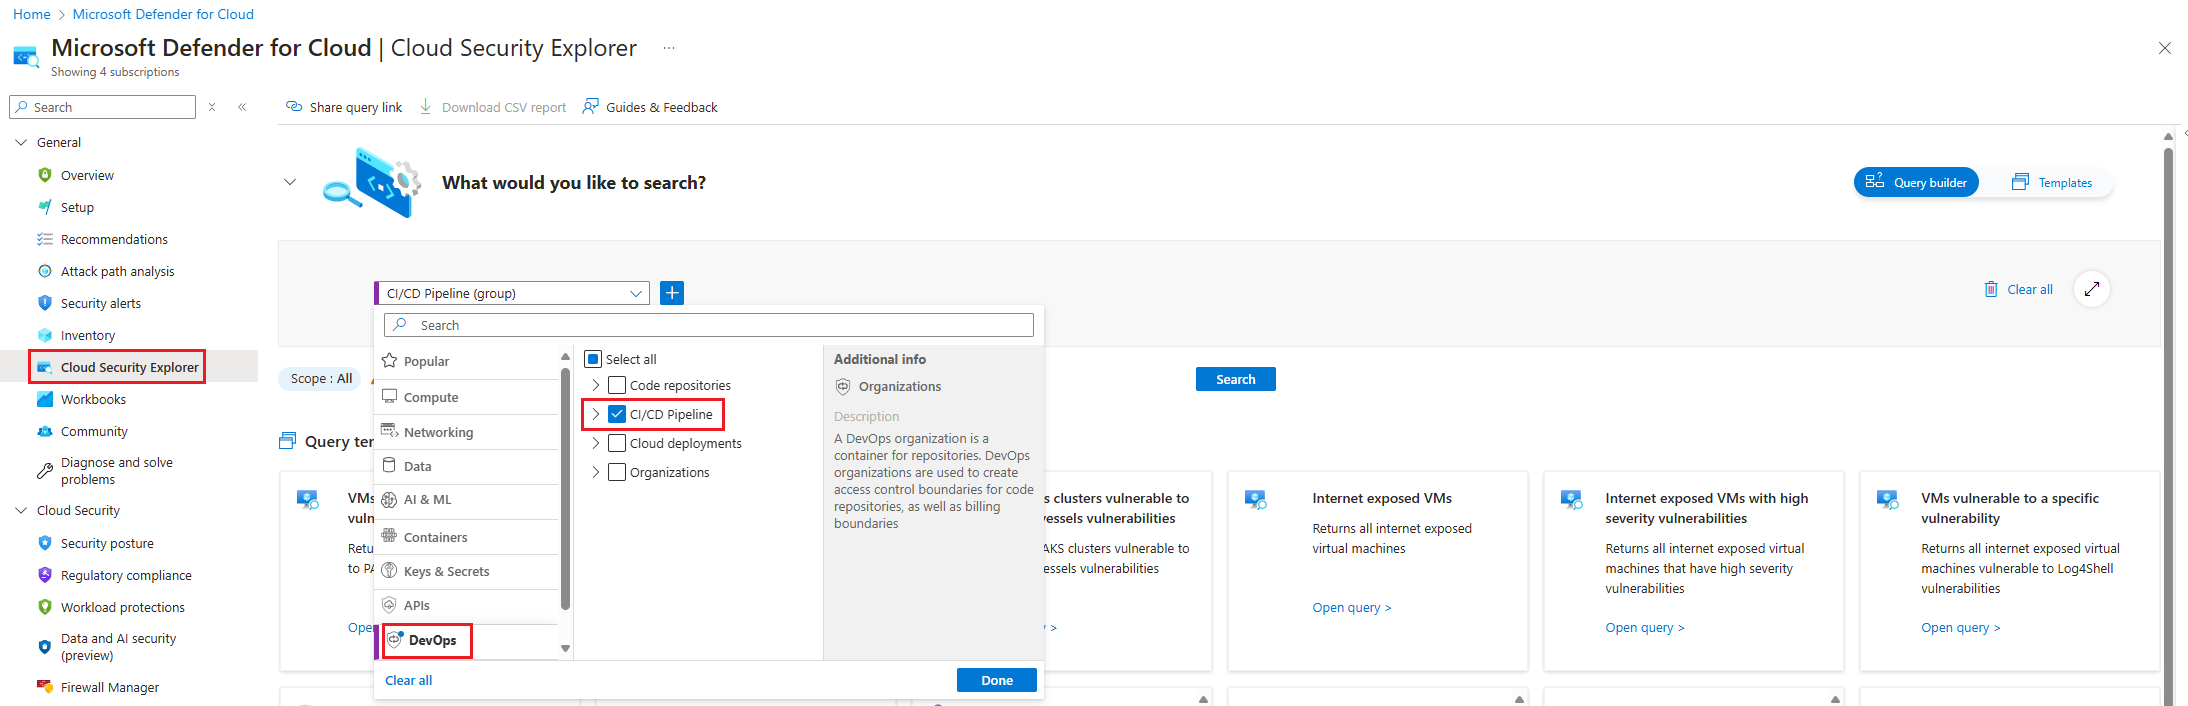
In the Defender for Cloud menu, select Cloud Security Explorer.
Select Select resource types dropdown, select DevOps, and then select Done.
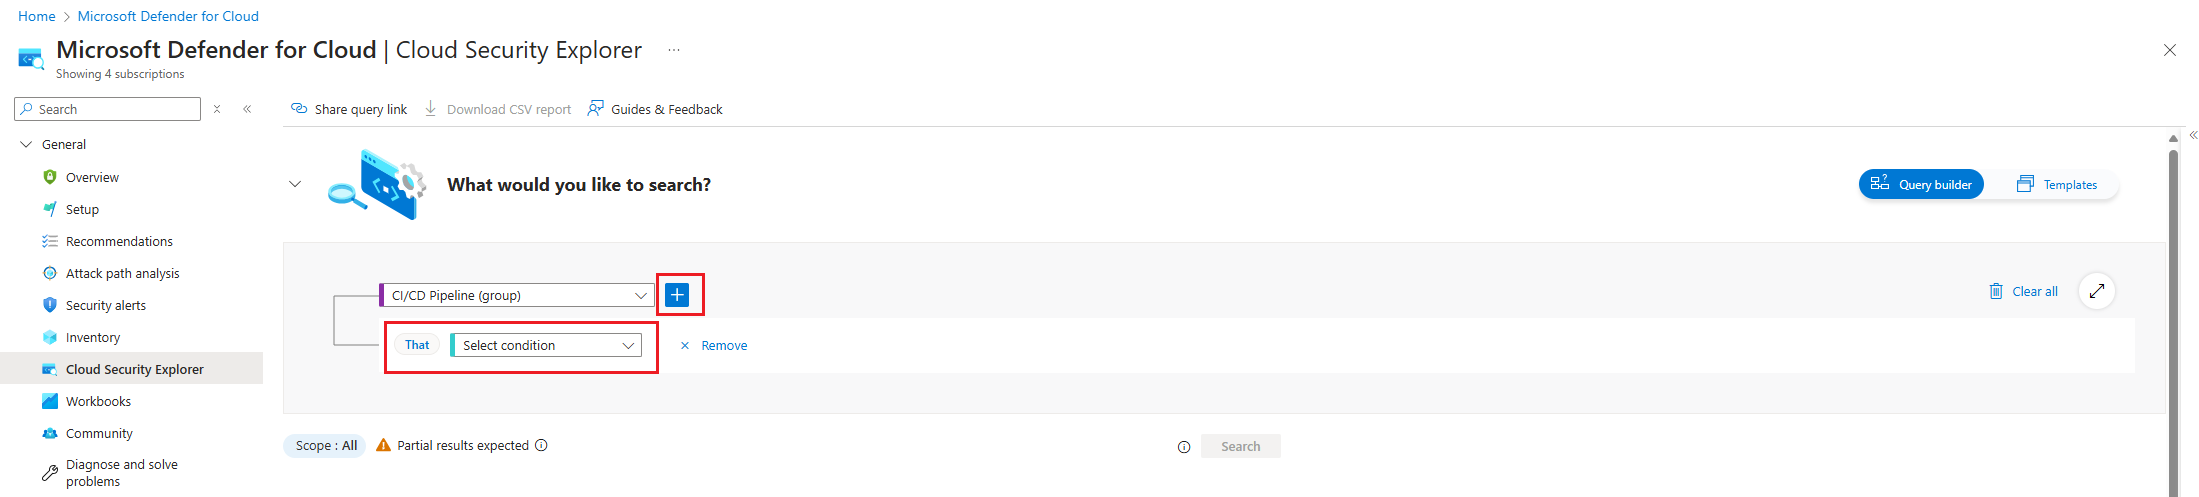
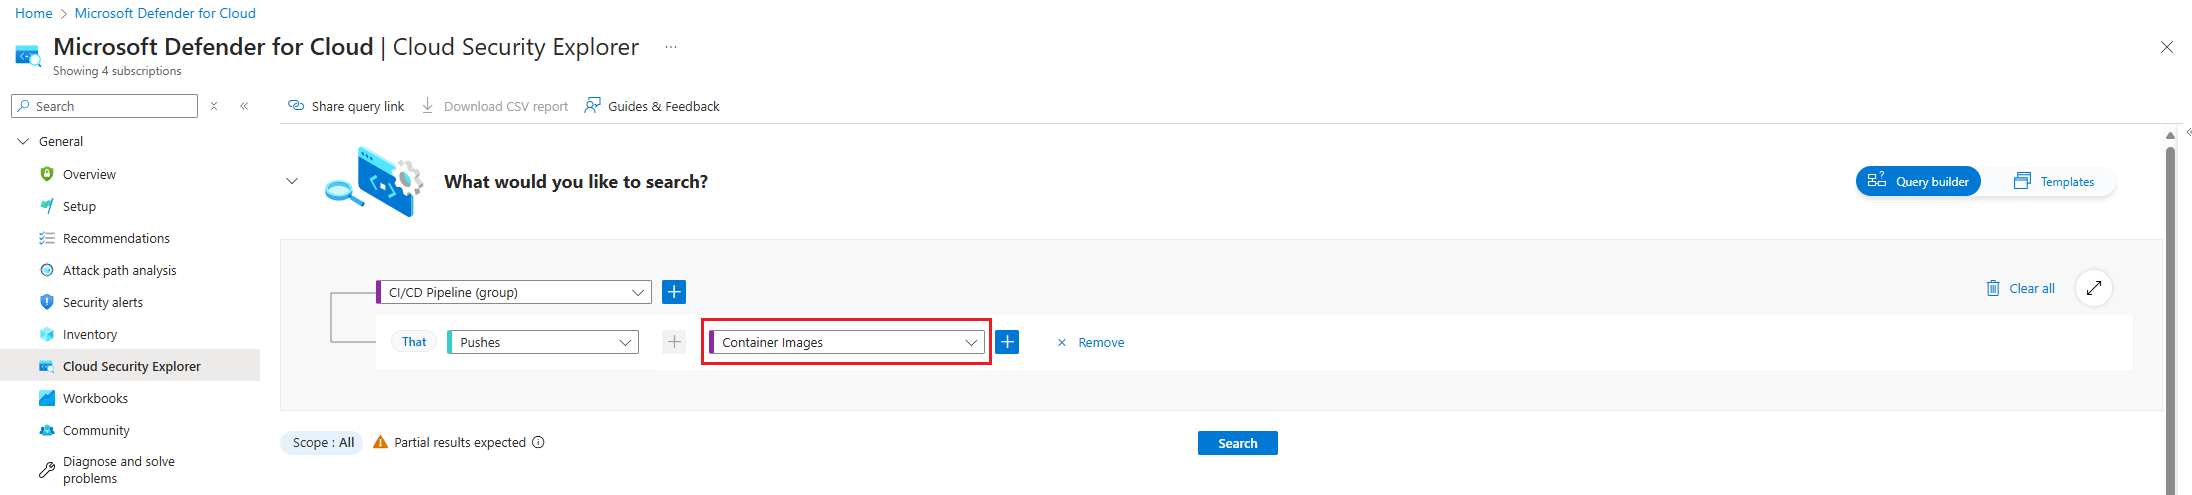
Select the + icon to add a new search criteria.
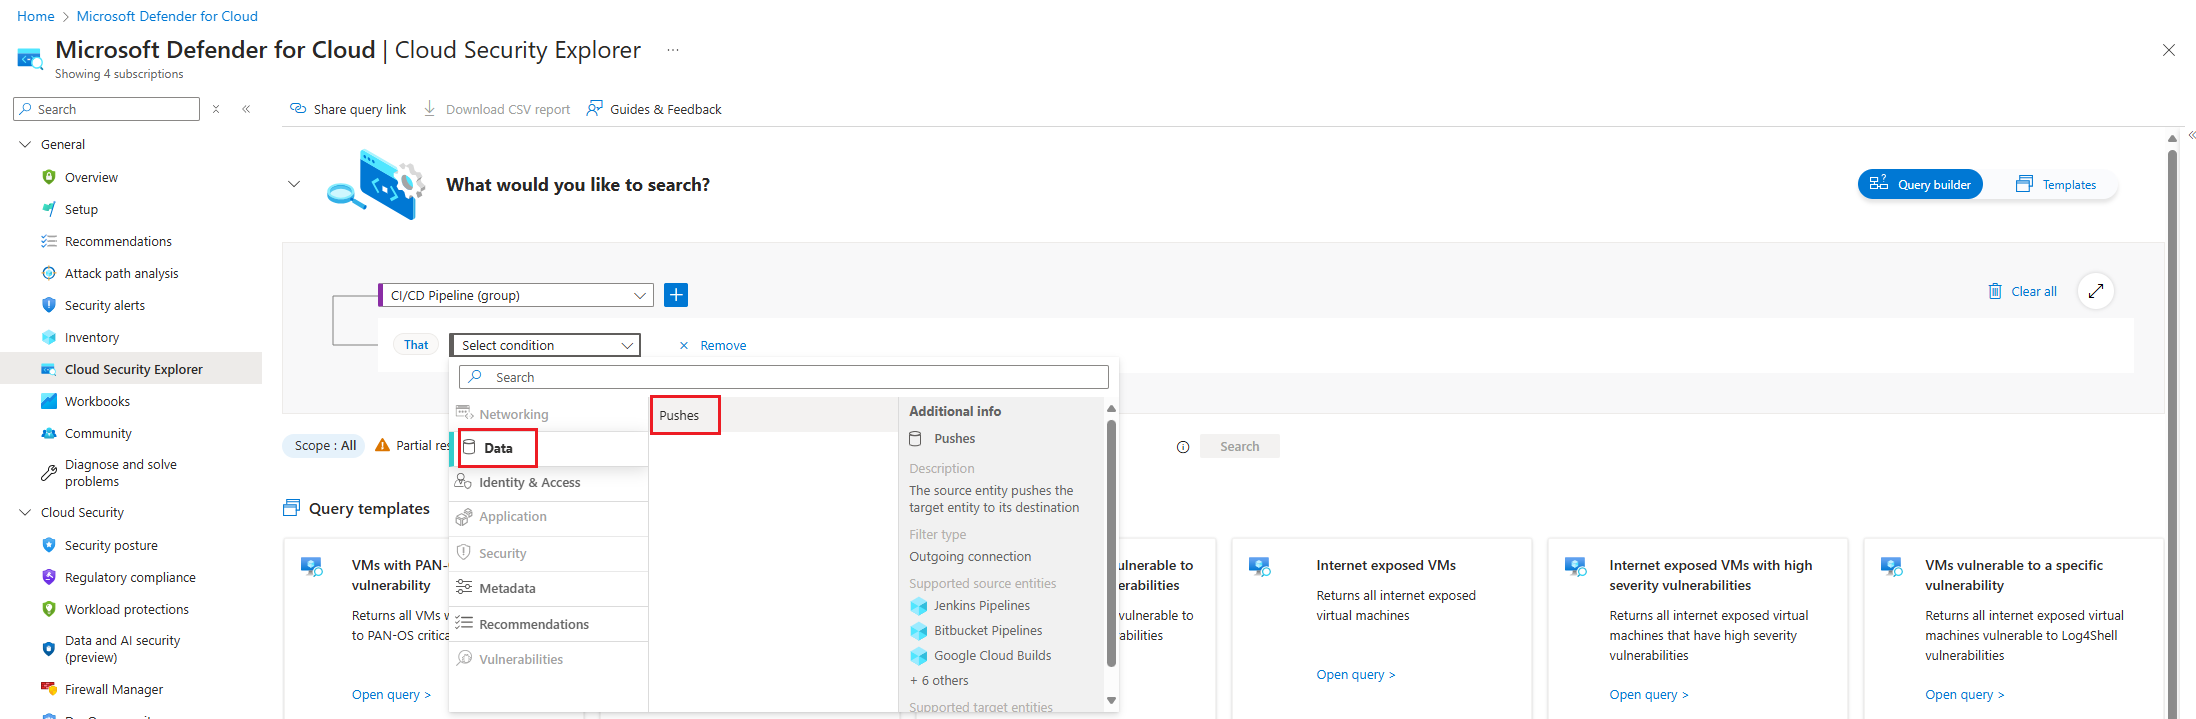
Choose the Select condition dropdown. Then select Data, and then select Pushes.
Choose the Select resource types dropdown. Then select Containers, then Container Images and then select Done.
Select the scope selected during the creation of the integration in Environment settings.
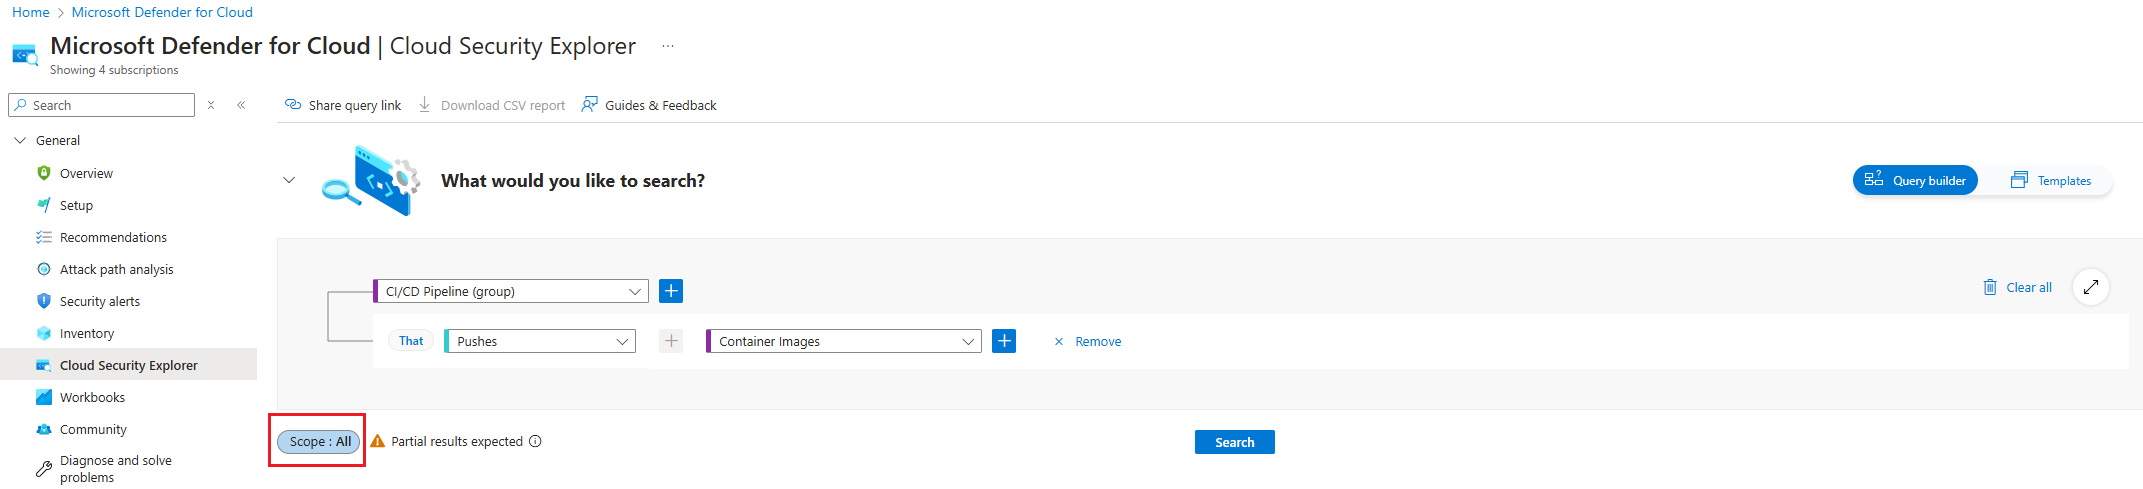
Select Search.
See the results of pipeline to images mapping.


Correlate with monitored containers
In Cloud Security Explorer, enter the following query: CI/CD Pipeline -> Pipeline + Container Images -> Contained in + Container registers (group).
Review the Resource names to see the container mapping.