Note
Access to this page requires authorization. You can try signing in or changing directories.
Access to this page requires authorization. You can try changing directories.
Question
Tuesday, June 9, 2015 2:37 AM
Hi,
My table has around 789 million records and it is partitioned on column "date_in" by month and year . Below is the sample query which is taking long time to return the records. Please advise.
Select id, product, cost,shipping_cost
from Test
where date_in between 01/01/2015 and 01/31/2015
group by product_title, weight, depth, length, width, carrier_type, carrier_method, handling_cost, shipping_type
Table Test. Scan count 9, logical reads 278912, physical reads 924, read-ahead reads 21363,
Execution Plan: Sort: Cost- 77%

All replies (29)
Tuesday, June 9, 2015 3:26 AM | 2 votes
Hi there! A couple things:
- You can see that the query is doing a substantial amount of reads and scanning the table 9 times. Each read physical and read-ahead read equals an 8k page. That's a lot of data. If your storage can't support the request in a timely manor then the query will take a long time. I would suggest reviewing the following article for more information: http://social.technet.microsoft.com/wiki/contents/articles/3214.monitoring-disk-usage.aspx You should also review the SQL Server error logs for any 833 (I/O taking longer than 15 seconds) alerts.
- Did you notice the 8 executions? That means that this operator happened 8 times! Can you post the whole query plan?

I hope you found this post helpful. If you did please mark it as helpful or the answer! :)
Tuesday, June 9, 2015 4:08 AM
Hi,
My table has around 789 million records and it is partitioned on column "date_in" by month and year . Below is the sample query which is taking long time to return the records. Please advise.
Select id, product, cost,shipping_cost
from Test
where date_in between 01/01/2015 and 01/31/2015
group by product_title, weight, depth, length, width, carrier_type, carrier_method, handling_cost, shipping_type
Table Test. Scan count 9, logical reads 278912, physical reads 924, read-ahead reads 21363,
Execution Plan: Sort: Cost- 77%
The problem lies with the query IMHO to comment further you must post exact query and complete execution plan on which column Clustered index is defined
Please mark this reply as answer if it solved your issue or vote as helpful if it helped so that other forum members can benefit from it
Tuesday, June 9, 2015 7:36 PM
Here you go.
;WITH CTE
AS(
select
  COMPANY,
  ID,
  REP_COMPANY,
  PROD
 FROM
  DAILY_TRANS A (NOLOCK),
  PLAN B (NOLOCK),
  REF_TRANS C (NOLOCK)
 WHERE
        A.time_in BETWEEN  '01/01/2014' AND '01/31/2014'
       AND B.PLAN = A.PLAN
       AND B.ID = A.ID
       AND B.TAX_ID = A.TAX_ID
       AND B.FLAG = 'Y'
       AND C.FLAG_ID = A.FLAG_ID
 )


 SELECT top 100
  time_in,
   SUM (
    CASE
     WHEN PROD IS NOT NULL
     THEN AMOUNT
     ELSE 0
    END
   ),
   SUM (
    CASE
     WHEN PROD IS NOT NULL AND DATEDIFF(DD,EFFECTIVE_DT,time_in) < 365
     THEN AMOUNT
     ELSE 0
    END
   ),
   SUM (
    CASE
     WHEN IND = 'R'
     THEN AMOUNT
     ELSE 0
    END
   ),
   null,
   SUM (
    CASE
     WHEN CD IS NOT NULL AND DATEDIFF(DD,EFFECTIVE_DT,time_in) < 365
     THEN AMOUNT
     ELSE 0
    END
   ),
   SUM (
    CASE
     WHEN CAT IN ('TEST')
     THEN AMOUNT
     ELSE 0
    END
   )
 INTO #TEMP
 FROM   CTE

 GROUP BY

SET STATISTICS IO OFF
SET STATISTICS TIME OFF

Friday, June 12, 2015 2:10 AM
....
Friday, June 12, 2015 4:35 PM
The CTE query and plan you posted is quite different from the original.
"Select id, product, cost,shipping_cost
from Test
where date_in between 01/01/2015 and 01/31/2015
group by product_title, weight, depth, length, width, carrier_type, carrier_method, handling_cost, shipping_type"
Is this a new question?
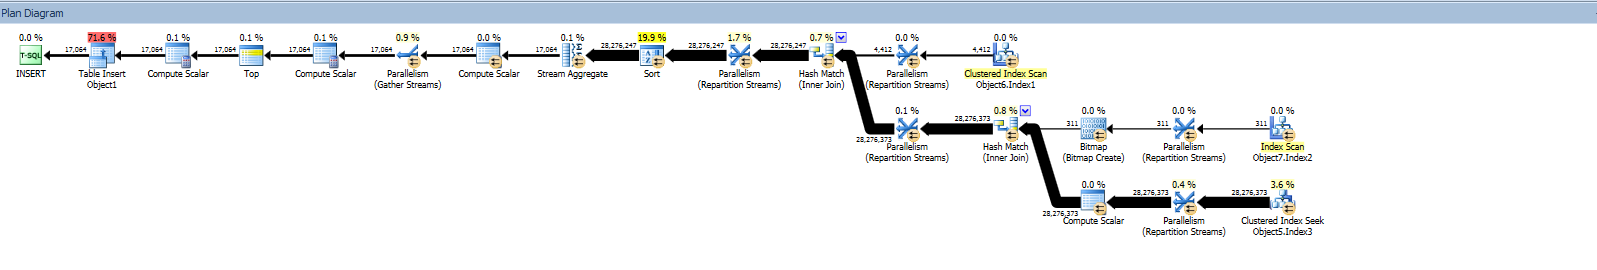
From looking at the query plan you can see that there is a SORT operator on and yet there is no order by or merge. The data is being sorted to do the aggregate. I would look to see (mouse over the sort operator) what is being sorted and if you can retrieve the data more efficiently being pre-sorted.
I hope you found this post helpful! If you did, please mark it as helpful or as the answer. :)
Wednesday, June 24, 2015 9:04 PM
No . It's the same question. Initially I didn't post the exact query.
What else should I look into here . Logical reads ? Scans ? or something else ?
Is the 278912 logical reads acceptable for the table with 789.6 million records and the select query range 28.2 million rows ?
Wednesday, June 24, 2015 9:52 PM
We have limited use of the graphical plan. We would need to see the actual execution plan in XML format. If you don't want share table names, you can use SQL Sentry Plan Explorer to anonymise the query.
http://www.sqlsentry.com/products/plan-explorer/sql-server-query-view
You can't post the XML here, but you would need to find somewhere to upload it. (Google Drive, Dropbox, etc).
Erland Sommarskog, SQL Server MVP, [email protected]
Thursday, June 25, 2015 4:32 AM
Thanks for your help.!!
Here you go...
https://drive.google.com/file/d/0B19qwikXI2sVako5Mk5wTWVnN00/view?usp=sharing
Thursday, June 25, 2015 5:47 AM
If you run only this query, how long does it take?
select
  COMPANY,
  ID,
  REP_COMPANY,
  PROD
 FROM
  DAILY_TRANS A (NOLOCK),
  PLAN B (NOLOCK),
  REF_TRANS C (NOLOCK)
 WHERE
        A.time_in BETWEEN  '01/01/2014' AND '01/31/2014'
       AND B.PLAN = A.PLAN
       AND B.ID = A.ID
       AND B.TAX_ID = A.TAX_ID
       AND B.FLAG = 'Y'
       AND C.FLAG_ID = A.FLAG_ID
Best Regards,Uri Dimant SQL Server MVP, http://sqlblog.com/blogs/uri_dimant/
MS SQL optimization: MS SQL Development and Optimization
MS SQL Consulting: Large scale of database and data cleansing
Remote DBA Services: Improves MS SQL Database Performance
SQL Server Integration Services: Business Intelligence
Thursday, June 25, 2015 3:48 PM
Thanks all for your help. Here is my exact query(ofcourse table names have been changed) which I'm trying to tune and currently taking 4-5 mins to finish . Also, you can see the tables details and other info below.
Database1.Schema1.Object5:
Total Records : 789.6 million
# of records between 01/01/2014 and 01/31/2014 : 28.2 million
My table has around 789 million records and it is partitioned on "Column19" by month and year .
Clustered index on Column19
Database1.Schema1.Object6:
Total Records : 24791
Database1.Schema1.Object7:
Total Records : 311
SQL Server Execution Times:
CPU time = 0 ms, elapsed time = 2 ms.
Table 'Database1.Schema1.Object6'. Scan count 9, logical reads 1082, physical reads 0, read-ahead reads 0, lob logical reads 0, lob physical reads 0, lob read-ahead reads 0.
Table 'Database1.Schema1.Object7'. Scan count 4, logical reads 4, physical reads 0, read-ahead reads 0, lob logical reads 0, lob physical reads 0, lob read-ahead reads 0.
Table 'Database1.Schema1.Object5'. Scan count 9, logical reads 280072, physical reads 283, read-ahead reads 130274, lob logical reads 0, lob physical reads 0, lob read-ahead reads 0.
Table 'Worktable'. Scan count 0, logical reads 0, physical reads 0, read-ahead reads 0, lob logical reads 0, lob physical reads 0, lob read-ahead reads 0.
(17064 row(s) affected)
(1 row(s) affected)
SQL Server Execution Times:
CPU time = 697975 ms, elapsed time = 254160 ms.
INSERT INTO Object1
  (
  Column3,
  Column4,
  Column5,
Column6,
  Column7,
  Column8,
  Column9,
  Column10,
  Column11,
  Column12,
  Column13,
  Column14,
  Column15,
  Column16,
  Column17,
  Column18
 )
SELECT
  Column3,
  Column4,
  Column5,
  Isnull(right(Column4,9), Isnull),
  Isnull(right(Column4,9), Isnull),
  Object2.Column8,
  Column9= Object2.Column8,
  Column10 = Object3.Column19,
  Column11 =
   Sum (
    CASE
     WHEN Object3.Column8 IS NOT NULL
     THEN Object3.Column20
     ELSE 0
    END
   ),
  Column12 =
   Sum (
    CASE
     WHEN Object3.Column8 IS NOT NULL AND Datediff(Column21,Object2.Column22,Object3.Column19) < 365
     THEN Object3.Column20
     ELSE 0
    END
   ),
  Column13 =
   Sum (
    CASE
     WHEN Object3.Column23 = ?
     THEN Object3.Column20
     ELSE 0
    END
   ),
   NULL,
  Column15 =
   Sum (
    CASE
     WHEN Object3.Column8 IS NOT NULL AND Datediff(Column21,Object2.Column22,Object3.Column19) < 365
     THEN Object3.Column20
     ELSE 0
    END
   ),
  Column16 =
   Sum (
    CASE
     WHEN Object4.Column24 IN ('abc', 'xyz', 'lmn' )
     THEN Object3.Column20
     ELSE 0
    END
   ),
  Column17 = 0,
  Object2.Column18
FROM
  Database1.Schema1.Object5 Object3

  INNER JOIN Database1.Schema1.Object6 Object2
   ON Object2.Column25 = Object3.Column25
   AND Object2.Column26 = Object3.Column26
   AND Object2.Column27 = Object3.Column27
   AND Object2.Column28 = 'Y'

  INNER JOIN Database1.Schema1.Object7 Object4
   ON Object4.Column29 = Object3.Column29

 WHERE
  Object3.Column19 BETWEEN '01/01/2014' AND '01/31/2014'
 GROUP BY
  Object3.Column30,
  Object3.Column31,
  Object3.Column32,
  Object3.Column25,
  Object3.Column26,
  Object3.Column19,
  Object2.Column33,
  Object2.Column22,
  Object2.Column8
  ,Object3.Column4
  ,Object3.Column3
  ,Object3.Column5
  ,Object2.Column18

Thursday, June 25, 2015 4:09 PM
It seems like we get a lot of this sort of thing.
Performance is dependent on a lot of things; for SQL it's a question of the amount of records, the amount of data retrieved; the required indexes are in place, the indexes and database stats being up to date to name just a few things.
On the system side you have to consider the disk speeds for TempDb, the data files and the Page File; the fibre link speed it disks are on a SAN/virtual Server etc; again just to name a few things.
You also have to consider other processes such as VSS Writer; Virus Scanning, SAN replication in case these may be causing performance issues.
Then we get to the amount of data being returned, it is a colossal amount of data; you are returning approx. 26Gb of data that SQL Server has had to search for; select; group and then return; is it such a surprise it took nearly 6 minutes to return the data considering the amount of work involved and data returned? I don't think so...
Please click "Mark As Answer" if my post helped. Tony C.
Thursday, June 25, 2015 4:44 PM
Here is the other info..


Thursday, June 25, 2015 4:45 PM
And top operations

Thursday, June 25, 2015 8:10 PM
but based on the above info I posted it can be optimized right ?
Thursday, June 25, 2015 10:18 PM
Here you go...
https://drive.google.com/file/d/0B19qwikXI2sVako5Mk5wTWVnN00/view?usp=sharing
Thanks! Unfortunately, I did not come around to look into this forum until too late, so I will have to look at this tomorrow or during the weekend, unless someone else have cracked it by then.
Erland Sommarskog, SQL Server MVP, [email protected]
Friday, June 26, 2015 2:57 AM
Thanks . Also, I posted other info as we'll in my previous replies.
Friday, June 26, 2015 9:13 PM
OK, I looked at this, and I can't say that I find 254 seconds in execution time for a query with those volumes alarming. I'm a little surprised though, that it uses a Sort operator to implement the GROUP BY. Then again, the sort does not seem to spill, so I guess there is memory enough. Nevertheless, you could try the effect of putting this at the end:
OPTION (HASH GROUP)
I see that this plan is from SQL 2008 R2. In SQL 2012 Microsoft introduced Columnstore indexes which they enhanced further in SQL 2014. If you have a machine with SQL 2014 around with space for this database, you could try the effect of making the clusterd index a columnstore index.
Erland Sommarskog, SQL Server MVP, [email protected]
Monday, June 29, 2015 3:14 PM
Thanks for your help. When I added OPTION (HASH GROUP) in my query the execution time came down to 1:33sec from 4mins which is good in dev server. However, When I executed the same updated query in prod it came down to only 3mins from 4:47mins.
The query is fetching the data in dev for 28million rows and in prod 53million rows.
Also, I have modified my query as in the below form and when I executed this in dev it came down to 40sec from 4mins but in prod it is still executing for the same amount of time which is 4mins.
When the query execution time came down from 4 mins to 40 sec in dev on 28 million rows the execution time should come down in prod as well right irrespective of number of rows(53 million rows) the query is trying to search ? That too the prod is so better than dev.
WITH Object1
AS(
select
  Object2.Column1,
  Object2.Column2,
  Object2.Column3,
  Object2.Column4,
  Object2.Column5,
  Object2.Column6,
  Object2.Column7,
  Object2.Column8,
  Object2.Column9,
  Object2.Column10,
  Object2.Column11,
  Object2.Column12,
  Object2.Column13,
  Object2.Column14
 FROM
  Database1.Schema1.Object3 Object2 (NOLOCK)
 WHERE
        Object2.Column6 BETWEEN '01/01/2014' AND '01/31/2014'
 GROUP BY
  Object2.Column1,
  Object2.Column2,
  Object2.Column3,
  Object2.Column4,
  Object2.Column5,
  Object2.Column6,
  Object2.Column7,
  Object2.Column8,
  Object2.Column9,
  Object2.Column10,
  Object2.Column11,
  Object2.Column12,
  Object2.Column13,
  Object2.Column14
  )


       INSERT INTO Object4
        (
        Column1,
        Column2,
        Column3,
        Column17,
        Column18,
        Column19,
        Column4,
        Column20,
        Column21,
        Column22,
        Column23,
        Column24,
        Column25,
        Column26,
        Column27,
        Column28,
        Column29,
        Column30,
        Column31
    )
        SELECT
        Column1,
        Column2,
        Column3,
        Isnull(right(Column2,9), Isnull) Column17,
        Isnull(right(Column2,9), Isnull) Column18,
        Column19= space(5),
        Object5.Column4,
        Column20= Object5.Column4,
        Column21 = space(5),
        Column22 = space(5),
        Column23 = Object2.Column6,
        Column24 =
            Sum (
                CASE
                    WHEN Object2.Column4 IS NOT NULL
                    THEN Object2.Column5
                    ELSE 0
                END
            ),
        Column25 =
            Sum (
                CASE
                    WHEN Object2.Column4 IS NOT NULL AND Datediff(Column32,Object5.Column33,Object2.Column6) < 365
                    THEN Object2.Column5
                    ELSE 0
                END
            ),
        Column26 =
            Sum (
                CASE
                    WHEN Object2.Column7 = ?
                    THEN Object2.Column5
                    ELSE 0
                END
            ),
        NULL,
        Column28 =
            Sum (
                CASE
                    WHEN Object2.Column4 IS NOT NULL AND Datediff(Column32,Object5.Column33,Object2.Column6) < 365
                    THEN Object2.Column5
                    ELSE 0
                END
            ),
        Column29 =
            Sum (
                CASE
                    WHEN Object6.Column34 IN ('abc', 'xyz', 'lmn' )
                    THEN Object2.Column5
                    ELSE 0
                END
            ),
        Column30 =  0,
        Object5.Column31
FROM Object1 Object2,
       Object7 Object5 (NOLOCK),
       Object8 Object6  (NOLOCK)
WHERE        Object5.Column11 = Object2.Column11
       AND   Object5.Column12 = Object2.Column12
       AND   Object5.Column13 = Object2.Column13
       AND   Object5.Column35 = 'Y'
       AND   Object6.Column14 = Object2.Column14

GROUP BY    Column1,
            Column2,
            Column3,
            Object5.Column4,
            Column6,
            Object5.Column31,
            Column8,
            Column9,
            Column10,
            Object2.Column11,
            Object2.Column12,
            Object5.Column36,
            Object5.Column33
Monday, June 29, 2015 10:12 PM
Did you check that query plans were the same in the production and development environments? Particularly, pay attention to hash and sort spills. That can easily happen if the memory grants are computed inaccurately due to some misestimate in the optimisation.
As I said in my previous post, you should defintely evaluate what a columnstore index can do for this query.
Erland Sommarskog, SQL Server MVP, [email protected]
Tuesday, June 30, 2015 1:33 PM
Currently we don't have machine with SQL 2012/2014. Yes, I checked both the dev and prod exec plans and didn't see anything alarming. In prod "clustered index seek" is taking 90% of the query cost. I'll post the XML's for exec plans later today.
Thursday, July 2, 2015 1:53 AM
Here are the XML's for exec plans for all the 3 prod queries. You can see all three in the below link.
Query1: Original query. Running around 4:47sec
Query2: Query with option(hash group) : Running 3 mins
Query3: Query that I modified which was came down to 40 sec from 4 min on dev but no luck on prod.
Thursday, July 2, 2015 9:54 PM
Is that plan for Query 3 from Dev or Prod? The plan for query 3 has a gross misestimation on the result of the first hash join. It's expected to produce 213 417 rows, but produces 53 million. Furthermore, it is followed by a DISTINCT Sort operator which is expected to reduce the result set to 1602 rows, but it only slashes the actual result in half to 26 million rows. The net result of this is an unfortunate choice of a loop join to Object8.
I can't say whether this misestimate is due to outdated statistics or unforseen correlation in the data. You can always factor out the statistics by updating statistics on the involved tables. Correlation that causes misestimates in the joins is more difficult to address without resorting to hints. The obvious choice would be OPTION (HASH JOIN, MERGE JOIN) to get that loop join out of the equation.
Erland Sommarskog, SQL Server MVP, [email protected]
Monday, July 6, 2015 1:57 PM
All the above plans are from prod only including query 3 . Also, I have already checked the statistics on all the tables involved in the query. The below are the details.
Database1.Schema1.Object3
Total Records : 789.6 million
Statistics : Updating daily
Object7
Total Records : 24791
Statistics : Updating daily
Object8
Total Records : 311
Statistics : Last updated on 04/13/2015
Since the total records are only 311 in Object8 and this table is read only, Do you think the statistics (last updated :04/13/2015) are causing the issue ?
Meanwhile I will run the query with OPTION (HASH JOIN, MERGE JOIN) and let you know . Thank you so much for your help on this.!!!
Monday, July 6, 2015 10:48 PM
Since the total records are only 311 in Object8 and this table is read only, Do you think the statistics (last updated :04/13/2015) are causing the issue ?
No. That is not where the problem is. The problem likes in somewhere in the join between Object3 and Object7. I'm leaning towards that this is a data correlation problem. That is, the optimizer assumes that the join produces far fewer rows than it actually does. This is a game which is by means easy for the optimizer.
Erland Sommarskog, SQL Server MVP, [email protected]
Thursday, July 9, 2015 7:27 PM
I have executed the query 3 with OPTION (HASH JOIN, MERGE JOIN) and it took more time than all the queries I executed so far.
When I execute the below statement on Object3 and Object7 I'm seeing that all the indexes are updating daily. However, it is not clear why in the execution plan we are seeing the misestimation on the result of the first hash join. 213,417 VS 53 million rows. What else should I look into ?
SELECT name AS index_name,
STATS_DATE(OBJECT_ID, index_id) AS StatsUpdated
FROM sys.indexes
WHERE OBJECT_ID = OBJECT_ID('dbo."object3"')
GO
Thursday, July 9, 2015 10:28 PM
As I mentioned that there can be correlation between the values that results in the join producing more rows than the optimizer expects. This is by no means an easy problem.
Too bad, that it did not work out with outlawing loop joins. Any chance you can share the plan for that case.
Else I think you try to get SQL 2014 on a machine and try the columnstore.
Erland Sommarskog, SQL Server MVP, [email protected]
Friday, July 10, 2015 2:31 PM
Sure. I'll share the plan. Mean while as I mentioned above when I execute the below statement on Object3 and Object7 I'm seeing that all the indexes are updating daily. Do you think if I still update the statistics using the below update statistics statement would that help ?
SELECT name AS index_name,
STATS_DATE(OBJECT_ID, index_id) AS StatsUpdated
FROM sys.indexes
WHERE OBJECT_ID = OBJECT_ID('dbo."object3"')
GO
update statistics "object3"
with fullscan
Friday, July 10, 2015 6:53 PM
Also, I noticed that the logical reads on the object 8 are very high(52759244) when I executed the Query 3 . See below. Why the logical reads are so high on the table which has only 311 records ?
Object8
Total Records : 311
Statistics : Last updated on 04/13/2015
Table 'object 8'. Scan count 0, logical reads 52759244, physical reads 0, read-ahead reads 0, lob logical reads 0, lob physical reads 0, lob read-ahead reads 0.
Friday, July 10, 2015 10:11 PM
Also, I noticed that the logical reads on the object 8 are very high(52759244) when I executed the Query 3 . See below. Why the logical reads are so high on the table which has only 311 records ?
Because it's accessed 26 million times, at least in the plan with the loop join. I'm a little puzzled why Scan count is 0, though.
Erland Sommarskog, SQL Server MVP, [email protected]