Note
Access to this page requires authorization. You can try signing in or changing directories.
Access to this page requires authorization. You can try changing directories.
Question
Sunday, December 10, 2017 4:05 PM
I want to find an interpolation value using any math method; linear, 2D or more complex.
I have two root arrays which have double type elements; the first one is X array and the next one is Y array.
The element of each X array corresponds to an element of Y array. Like this:
double [] X = {1.2,4.5,23,86};
double [] Y = {19,75,123,344};
As an example, I would like to find out what value will be in the Y array for "10" value to be represented in the X array.
Please help me, thanks.
All replies (9)
Sunday, December 10, 2017 4:46 PM
Start with this simple method:
double x = 10;
int i = Array.FindIndex( X, k => x <= k );
double y = Y[i - 1] + ( x - X[i - 1] ) * ( Y[i] - Y[i - 1] ) / ( X[i] - X[i - 1] );
Sunday, December 10, 2017 10:44 PM
System.IndexOutOfRangeException occurred
Monday, December 11, 2017 4:55 PM
@ProMudix, check again, please. Viorel_'s code works very well for me (Result: 89,2702702702703).
wizend
Tuesday, December 12, 2017 2:56 AM
Hello ProMudix,
Your question is more related to numerical analysis. For how to calculate the Y corresponding to 10, it exists some method to achieve it, like Lagrange interpolation, Newton polynomial and so on. The following links will give you better understanding. And also includes C# example.
http://www.mosismath.com/Lagrange/Lagrange.html
http://wmueller.com/precalculus/families/lagrange.html
http://fourier.eng.hmc.edu/e176/lectures/ch7/node4.html
https://en.wikipedia.org/wiki/Newton_polynomial
Best regards,
Neil Hu
MSDN Community Support
Please remember to click "Mark as Answer" the responses that resolved your issue, and to click "Unmark as Answer" if not. This can be beneficial to other community members reading this thread. If you have any compliments or complaints to MSDN Support, feel free to contact [email protected].
Sunday, December 24, 2017 8:22 AM
Hello proMudix,
Is there any update or any other assistance I could provide? You could mark the helpful reply as answer if the issue has been solved. And if you have any concerns, please do not hesitate to let us know.
Thank you for your understanding and patience!
Best regards,
Neil Hu
MSDN Community Support
Please remember to click "Mark as Answer" the responses that resolved your issue, and to click "Unmark as Answer" if not. This can be beneficial to other community members reading this thread. If you have any compliments or complaints to MSDN Support, feel free to contact [email protected].
Friday, January 19, 2018 3:21 PM
I didn’t get exactly the result I wanted. Before sent my question; I randomly assigned the numerical figures I gave above. I see that the code given by many people works in these numbers. On the other hand, there is a missing part; most of the numbers I want to work with are decimal numbers. When I try the codes and the codes I find somewhere, I am constantly getting an index error and I still cant find a solution. If the spline type graph has an unordered path to x values versus y values, it will satisfy me on this path. Thank you.
Monday, January 22, 2018 3:22 AM | 1 vote
Hi ProMudix,
You can show us some code about how you calculate the "Y" value, so we can discuss about why you encountered errors.
By the way, you can provide more information about your question, will you calculate the "Y" value corresponding to the "X" value that doesn't fall in the range of root X array?
Best Regards,
Charles He
MSDN Community Support
Please remember to click "Mark as Answer" the responses that resolved your issue, and to click "Unmark as Answer" if not. This can be beneficial to other community members reading this thread. If you have any compliments or complaints to MSDN Support, feel free to contact [email protected].
Tuesday, February 13, 2018 10:02 PM
Hi ProMudix,
You can show us some code about how you calculate the "Y" value, so we can discuss about why you encountered errors.
By the way, you can provide more information about your question, will you calculate the "Y" value corresponding to the "X" value that doesn't fall in the range of root X array?
Best Regards,
Charles He
MSDN Community Support
Please remember to click "Mark as Answer" the responses that resolved your issue, and to click "Unmark as Answer" if not. This can be beneficial to other community members reading this thread. If you have any compliments or complaints to MSDN Support, feel free to contact [email protected].
I'll give an example.
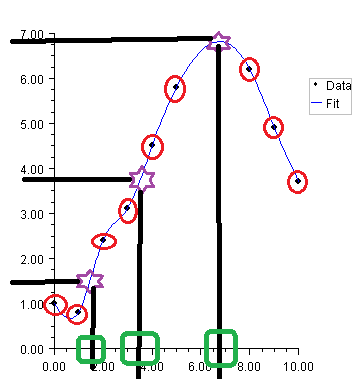
I created a graph in spline type using C# Chart tool. So, when arranged this graph I referenced each element in the two double type X and Y arrays.
I need the specific points between the X-Y data values which I used. I have known only the Y value of these points, but I cant find the corresponding X value.
Here is another example pic.
The red circles represent my X and Y values.
Purple stars represent corresponding values that I need.
I can assign these values are on the Y-axis but the green rectangles are the values which I cant find.
Thursday, February 15, 2018 7:39 PM
Hi ProMudix,
You can show us some code about how you calculate the "Y" value, so we can discuss about why you encountered errors.
By the way, you can provide more information about your question, will you calculate the "Y" value corresponding to the "X" value that doesn't fall in the range of root X array?
Best Regards,
Charles He
MSDN Community Support
Please remember to click "Mark as Answer" the responses that resolved your issue, and to click "Unmark as Answer" if not. This can be beneficial to other community members reading this thread. If you have any compliments or complaints to MSDN Support, feel free to contact [email protected].I'll give an example.
I created a graph in spline type using C# Chart tool. So, when arranged this graph I referenced each element in the two double type X and Y arrays.
I need the specific points between the X-Y data values which I used. I have known only the Y value of these points, but I cant find the corresponding X value.
Here is another example pic.
The red circles represent my X and Y values.
Purple stars represent corresponding values that I need.
I can assign these values are on the Y-axis but the green rectangles are the values which I cant find.
Is there anyone who can find any solution?