Microsoft Teams app usage report
The Teams app usage report in the Microsoft Teams admin center provides you with insights about which apps users are using in Teams. You can gain insights into the apps activity in your organization for different microsoft (Viva Learning, Shifts etc.), third-party (Polly, Trello etc.) & Line of Business (LOB) Teams apps.
You can use this report to understand where exactly different apps are getting used and deep dive into per-app utilization data.
The data represented in this report provide answers to the following questions:
- How many installed apps do users in your environment have?
- How many apps have at least one active user in your environment based on type (Microsoft, third-party, and LOB)?
- How many apps are being used per platform (Windows, Mac, web, or mobile)?
- How many active users and active teams are using an app?
Note
Usage for Side loaded LOB apps is not included in this report.
This article explains how to access the report and view and interpret the various metrics within the report.
View the app usage report
You must be either a global admin, global reader, or Teams service admin to view the reports in the Microsoft Teams admin center. See Use Teams administrator roles to manage Teams to read about getting admin roles and permissions.
In the left navigation of the Microsoft Teams admin center, select Analytics & reports > Usage reports. On the View reports tab, under Report, select Apps usage.
Under Date range, select a range and then select Run report.
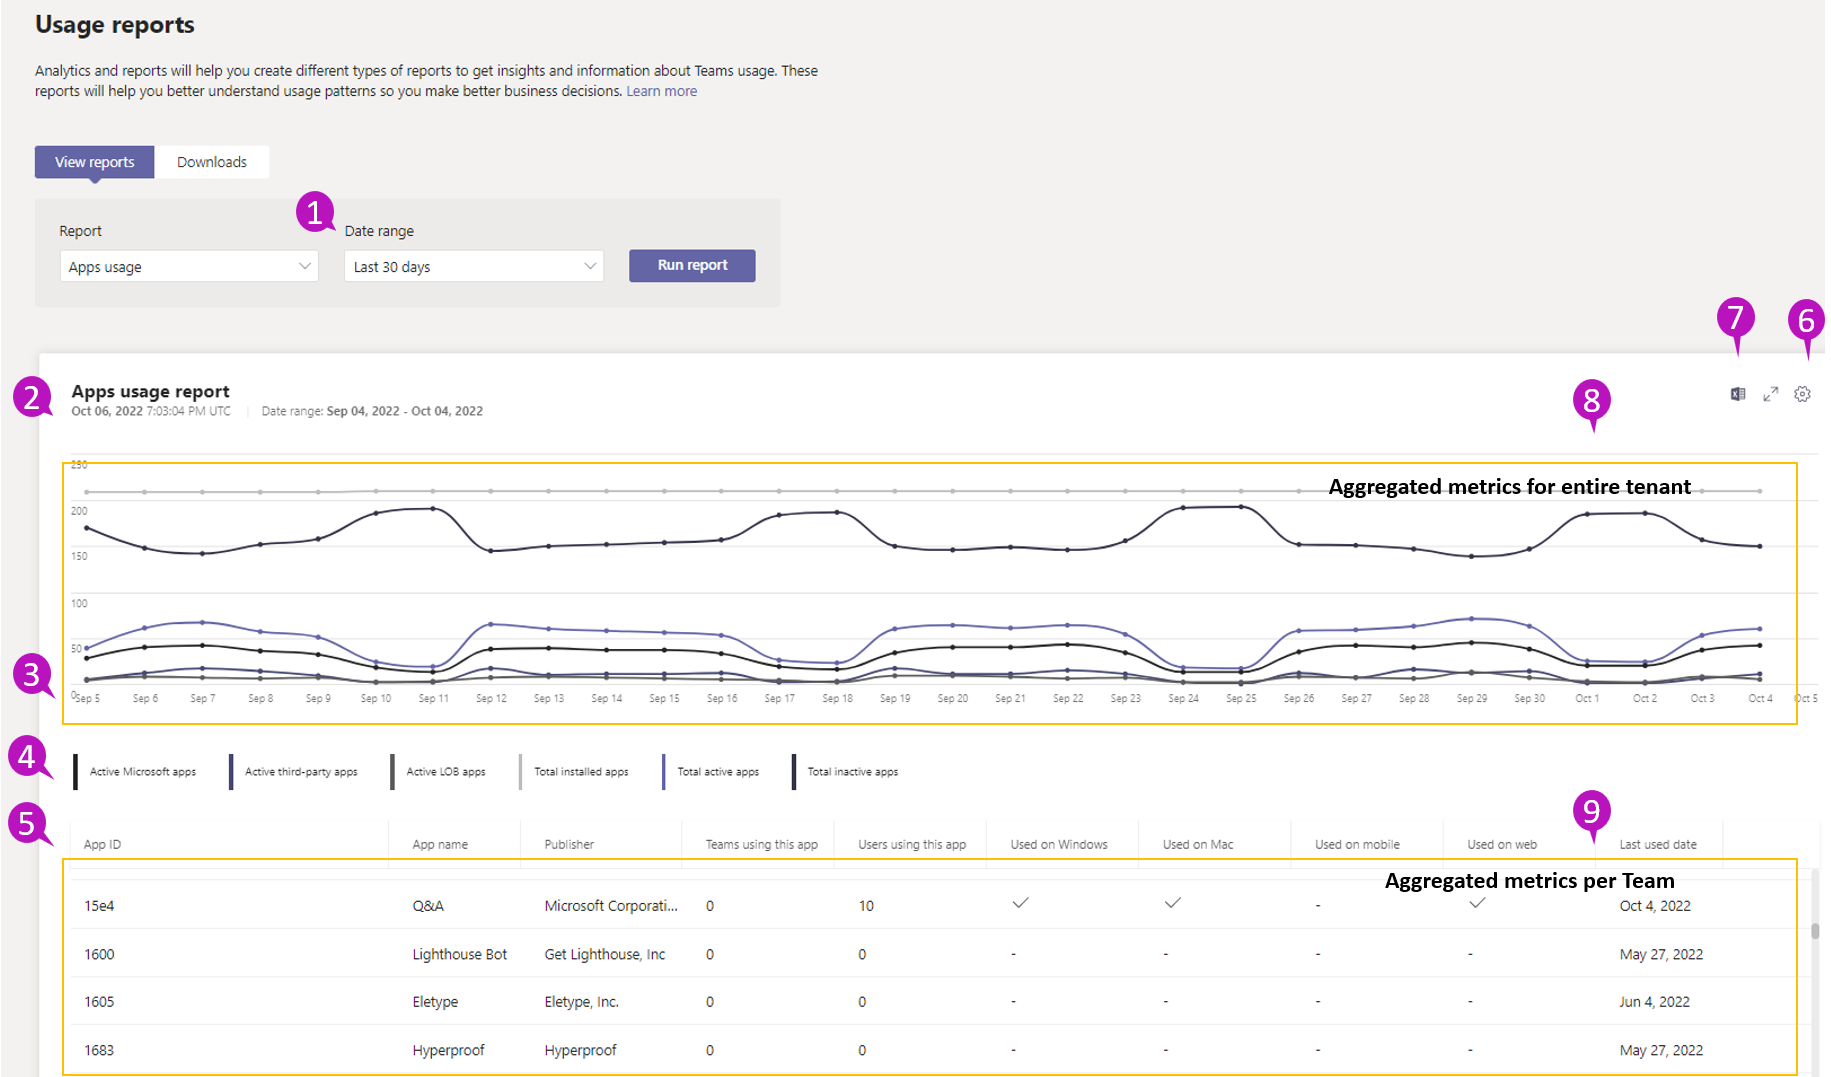
Interpret the report
| Callout | Description |
|---|---|
| 1 | The app usage report can be viewed for trends over the last 7, 30, 90, and 180 days. |
| 2 | Each report has a date for when this report was generated. Reports usually reflect a 24-48 hour latency from the time an app was used. For example, data for January 10th should show up in the report by around January 12th. |
| 3 |
|
| 4 | You can filter what you see on the chart by selecting an item in the legend. For example, select Active Microsoft apps, Total installed apps, and more to see only the info related to each one. Changing this selection doesn’t change the information in the table.
|
| 5 | The table gives you a breakdown of usage by each app.
|
| 6 | Select Edit columns to add or remove columns in the table. |
| 7 | Export the report to a CSV file for offline analysis. Select the Export to Excel icon, and the report will be downloaded within your browser. |
| 8 | Time series data represented in the top graph show different usage metrics aggregated for the entire tenant. |
| 9 | Tabular data represented in the bottom half shows different usage metrics aggregated per team. |
Managing apps in the Microsoft Teams admin center
For more information about how to manage your Teams apps, refer to About apps in Microsoft Teams.
To link an app in this report to the Manage Apps experience in the Microsoft Teams admin center, you can use the following:
- App Name
- External App ID
External App IDs are equivalent to the ID in the Manage apps page for Store apps. For LOB apps, the External app ID column can be enabled in the Manage apps section in Teams admin center column settings. You can also view it on the app details page of a custom LOB app.
