Note
Access to this page requires authorization. You can try signing in or changing directories.
Access to this page requires authorization. You can try changing directories.
After you set up and run the Sales Opportunity Agent, monitor its performance by viewing insights and metrics. These insights help you understand how effectively the agent is engaging with customers and driving sales.
The insights dashboard is displayed as shown in the following image:
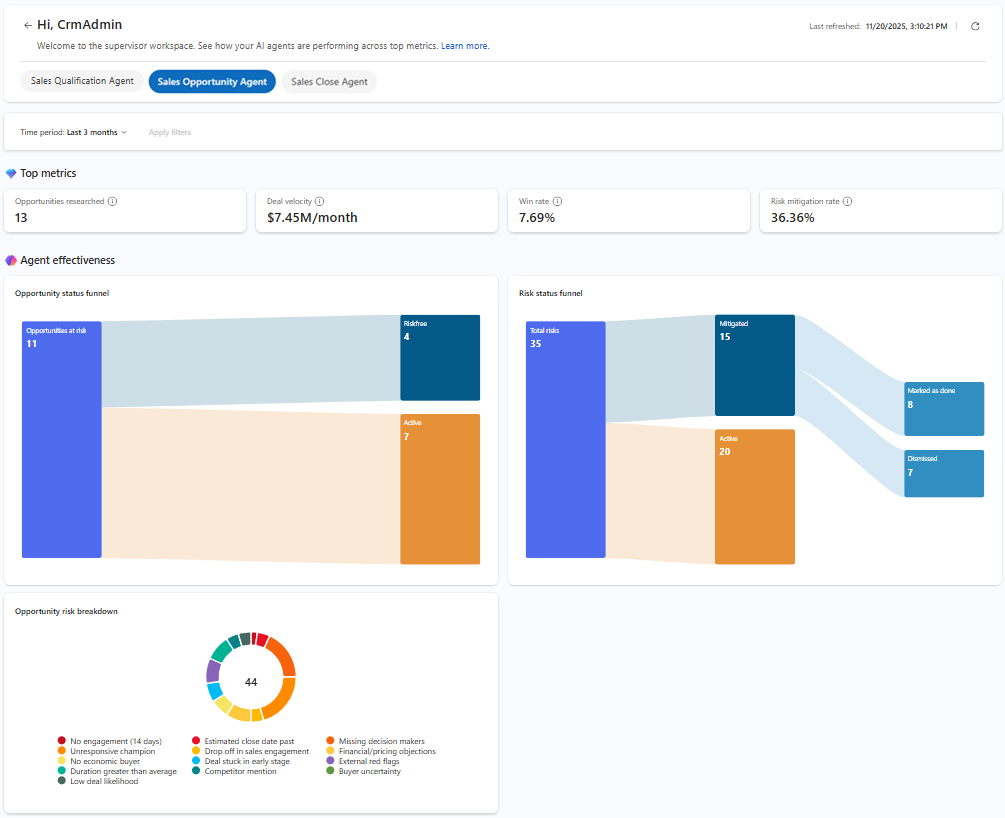
Open the insights dashboard
- In the Sales Hub app, go to App settings.
- Under General settings, select Dynamics 365 AI hub. If you have trouble finding or accessing the AI hub, it might be due to permission restrictions. To learn more, see Access Dynamics 365 AI Hub.
- In the AI Optimization hub card, select See insights.
The Agent insights page opens with the available insights for the agents configured in your organization. - Select the Sales Opportunity Agent tab.
- Verify the Last refreshed date and time to ensure the data is up-to-date. The data refreshes when you open the dashboard. If needed, you can refresh the dashboard by selecting the Refresh icon.
- Select the Time period filter to specify the period for which you want to view the data. By default, the dashboard shows data for the last seven days.
Understand the insights and metrics
Top metrics
| Metric | Description |
|---|---|
| Opportunities researched | Total number of opportunities where research is completed by the agent. |
| Deal velocity | Average revenue generated per month from opportunities researched by the agent. |
| Win rate | Percentage of opportunities researched by the agent that are closed as won. |
| Risk mitigation rate | Percentage of opportunities with risk that sellers acted upon. |
Agent effectiveness
Opportunity status funnel
| Stage | Description |
|---|---|
| Opportunities at risk | Total number of opportunities the agent identifies as at risk. |
| Riskfree | Opportunities that are no longer at risk after seller intervention. |
| Active | Opportunities where risk is still present and requires further action. |
Risk status funnel
| Stage | Description |
|---|---|
| Total risks | Total number of risks the agent identifies across all researched opportunities. |
| Mitigated | Total number of risks that the agent successfully mitigates. |
| Active | Total number of risks that are still active and require attention. |
| Marked as done | Total number of risks that sellers mark as resolved. |
| Dismissed | Total number of risks that sellers dismiss. |
Opportunity risk breakdown
The doughnut chart provides a breakdown of the different types of risks the agent identifies across all researched opportunities. Each segment represents a specific risk category, so sellers can quickly identify prevalent issues.